Exploratory data analysis, from first plot to fitted model
No install. No sign-up. No data upload.
Drop a CSV — graph it, fit a model, inspect the diagnostics.
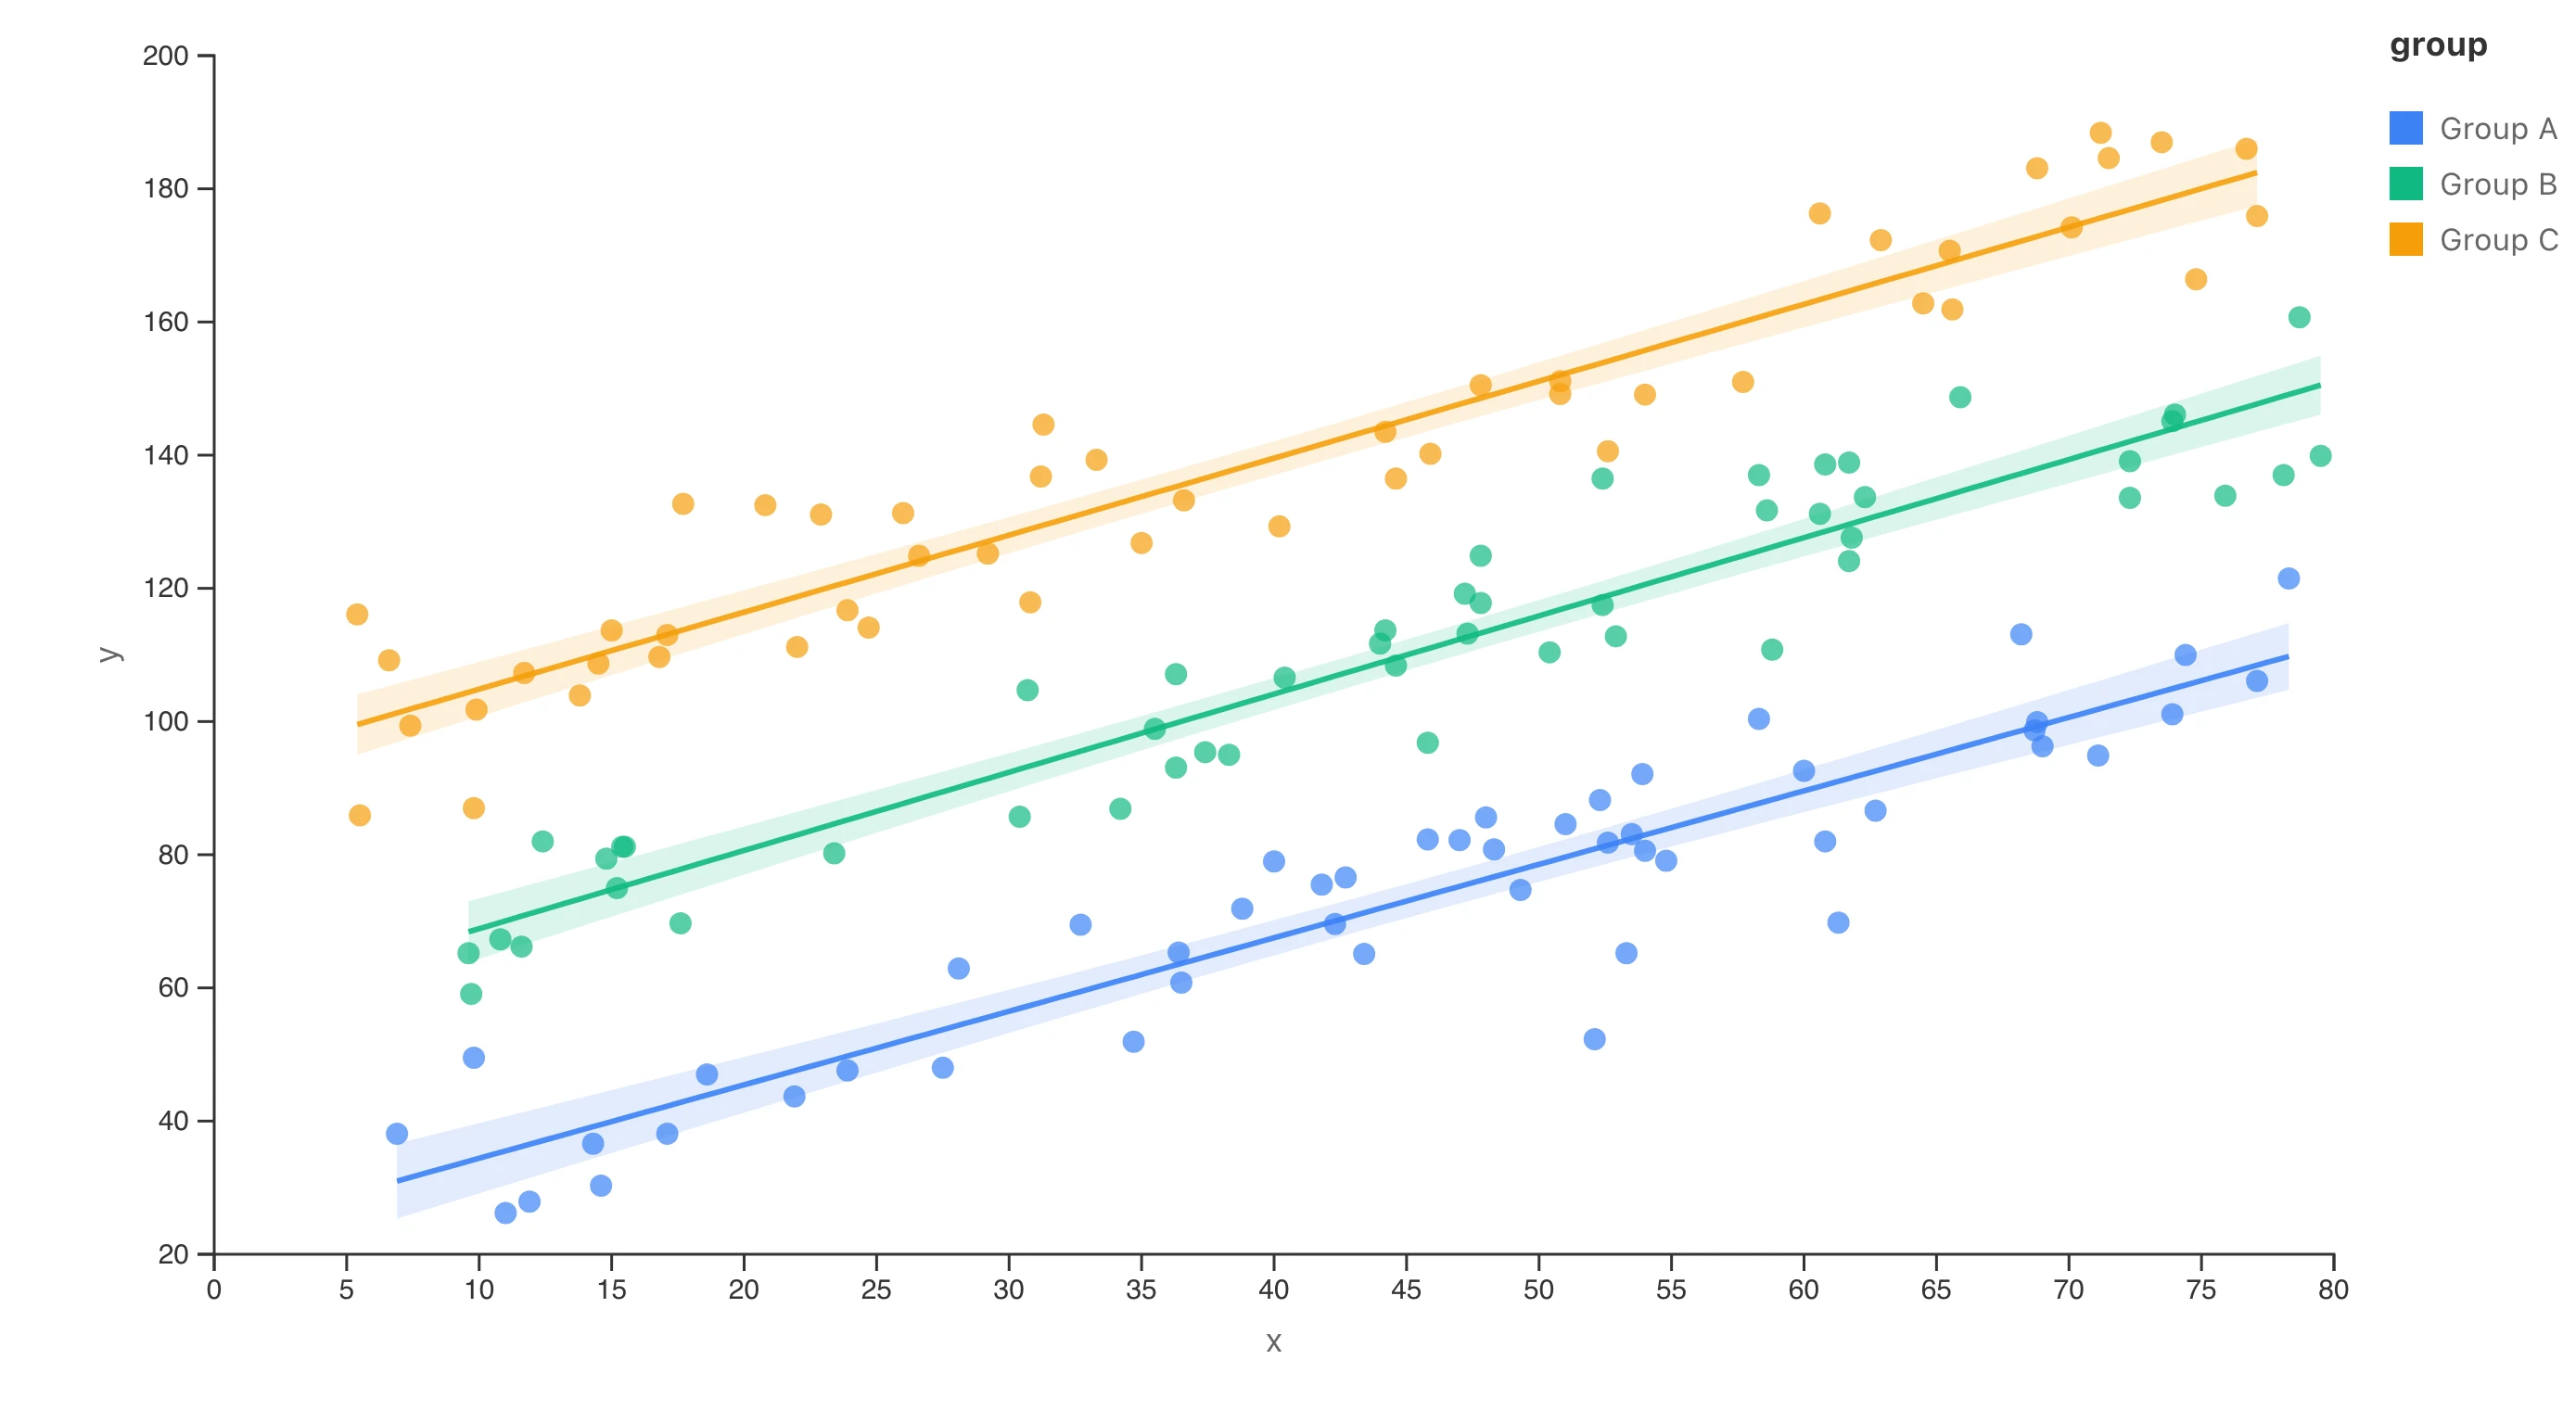


Scatter with regression lines and 95% confidence bands
No install. No sign-up. No data upload.
Drop a CSV — graph it, fit a model, inspect the diagnostics.
Scatter with regression lines and 95% confidence bands
Fitting a model is not a separate step — it is how exploring continues. Configure and run models point-and-click. Coefficient tables report effect estimates with confidence intervals rather than p-values, and built-in residual diagnostics let you question the fit.
OLS · GLM · GLMM · ANOVA · PCA · Random Forest · ARIMA · Cox proportional hazards · Kaplan–Meier
Read the model guides

Based on the Grammar of Graphics: statistical transforms — regression fits, densities, survival curves — stack onto geometries as layers, with facets when one panel is not enough.
See how layers and facets work


Datasets, derived tables, models, and reports form a dependency graph, so any number can be traced back to the data and steps that produced it. Save the whole project as a single file and reopen it later — the chain comes back with it.


DuckDB SQL with instant results
Write DuckDB SQL to filter, join, and transform; derived tables feed straight back into graphs and models. Computed columns, cross-tabulation, column type conversion, and wide–long reshaping are built in.
Browse the data processing guidesThe window.midas API is designed for AI agents operating the running app: loading data, fitting models, and reading results in the same project you see on screen. It describes itself through help(), so an agent can discover what it can do at runtime.
const result = await window.midas.models.run({
  type: 'glm',
  datasetId: 'ds_001',
  yColumn: 'deaths',
  xColumns: ['dose', 'group'],
  family: 'poisson'
});
// result.data.coefficients: estimates with 95% CIsAll computation happens in your browser — no server receives your data. Install it as an app and keep working offline.
Read how your data is handledOpen MIDAS and drop your CSV. No account required —
sample datasets are built in if you just want to try it.