The Kaplan-Meier Tab
The Kaplan-Meier tab estimates the survival function nonparametrically and compares groups using RMST (formulation). Visually assess differences in survival between groups and quantify them using restricted mean survival time. See Survival Analysis Fundamentals for the mathematical background.
To estimate the effect of covariates on hazard, use The Cox Regression Tab.
Data Requirements
Kaplan-Meier analysis requires two variables:
- Time variable: Time to event (numeric)
- Event variable: Indicates whether the event occurred. The following formats are supported:
- int64: 1 = event, 0 = censored
- Boolean: true = event, false = censored
float64 columns cannot be selected as the event variable. If a column stores 0/1 values as decimals, convert it to int64 with The Convert Column Types Tab.
MIDAS accepts only 0 and 1 (false and true for boolean columns) as event variable values. If the selected column contains any other value, MIDAS shows an error listing which values appear in how many rows and does not run the analysis. If your data uses another coding scheme, such as 1 = censored and 2 = event, convert it to 0/1 with the SQL Query Editor tab.
MIDAS accepts only positive values for the time variable. If the column contains zero or negative values, MIDAS shows an error listing which values appear in how many rows and does not run the analysis.
See Survival Analysis Fundamentals for how censoring is handled. MIDAS only supports right censoring. Left censoring, interval censoring, and competing risks are not supported.
Basic Usage
- Select Analysis > Survival Analysis > Kaplan-Meier... from the menu bar
- Select the Time Variable
- Select the Event Variable
- Optionally select a Group Variable for group comparison
- Click Run Analysis
The Group Variable dropdown lists only columns whose scale of measurement is Nominal or Ordinal. A column encoded as 0/1 integers, such as anaemia, is read as numeric and cannot be selected as is. Change its scale of measurement to Nominal in the Data Table tab first. See the Kaplan-Meier tutorial for the steps.
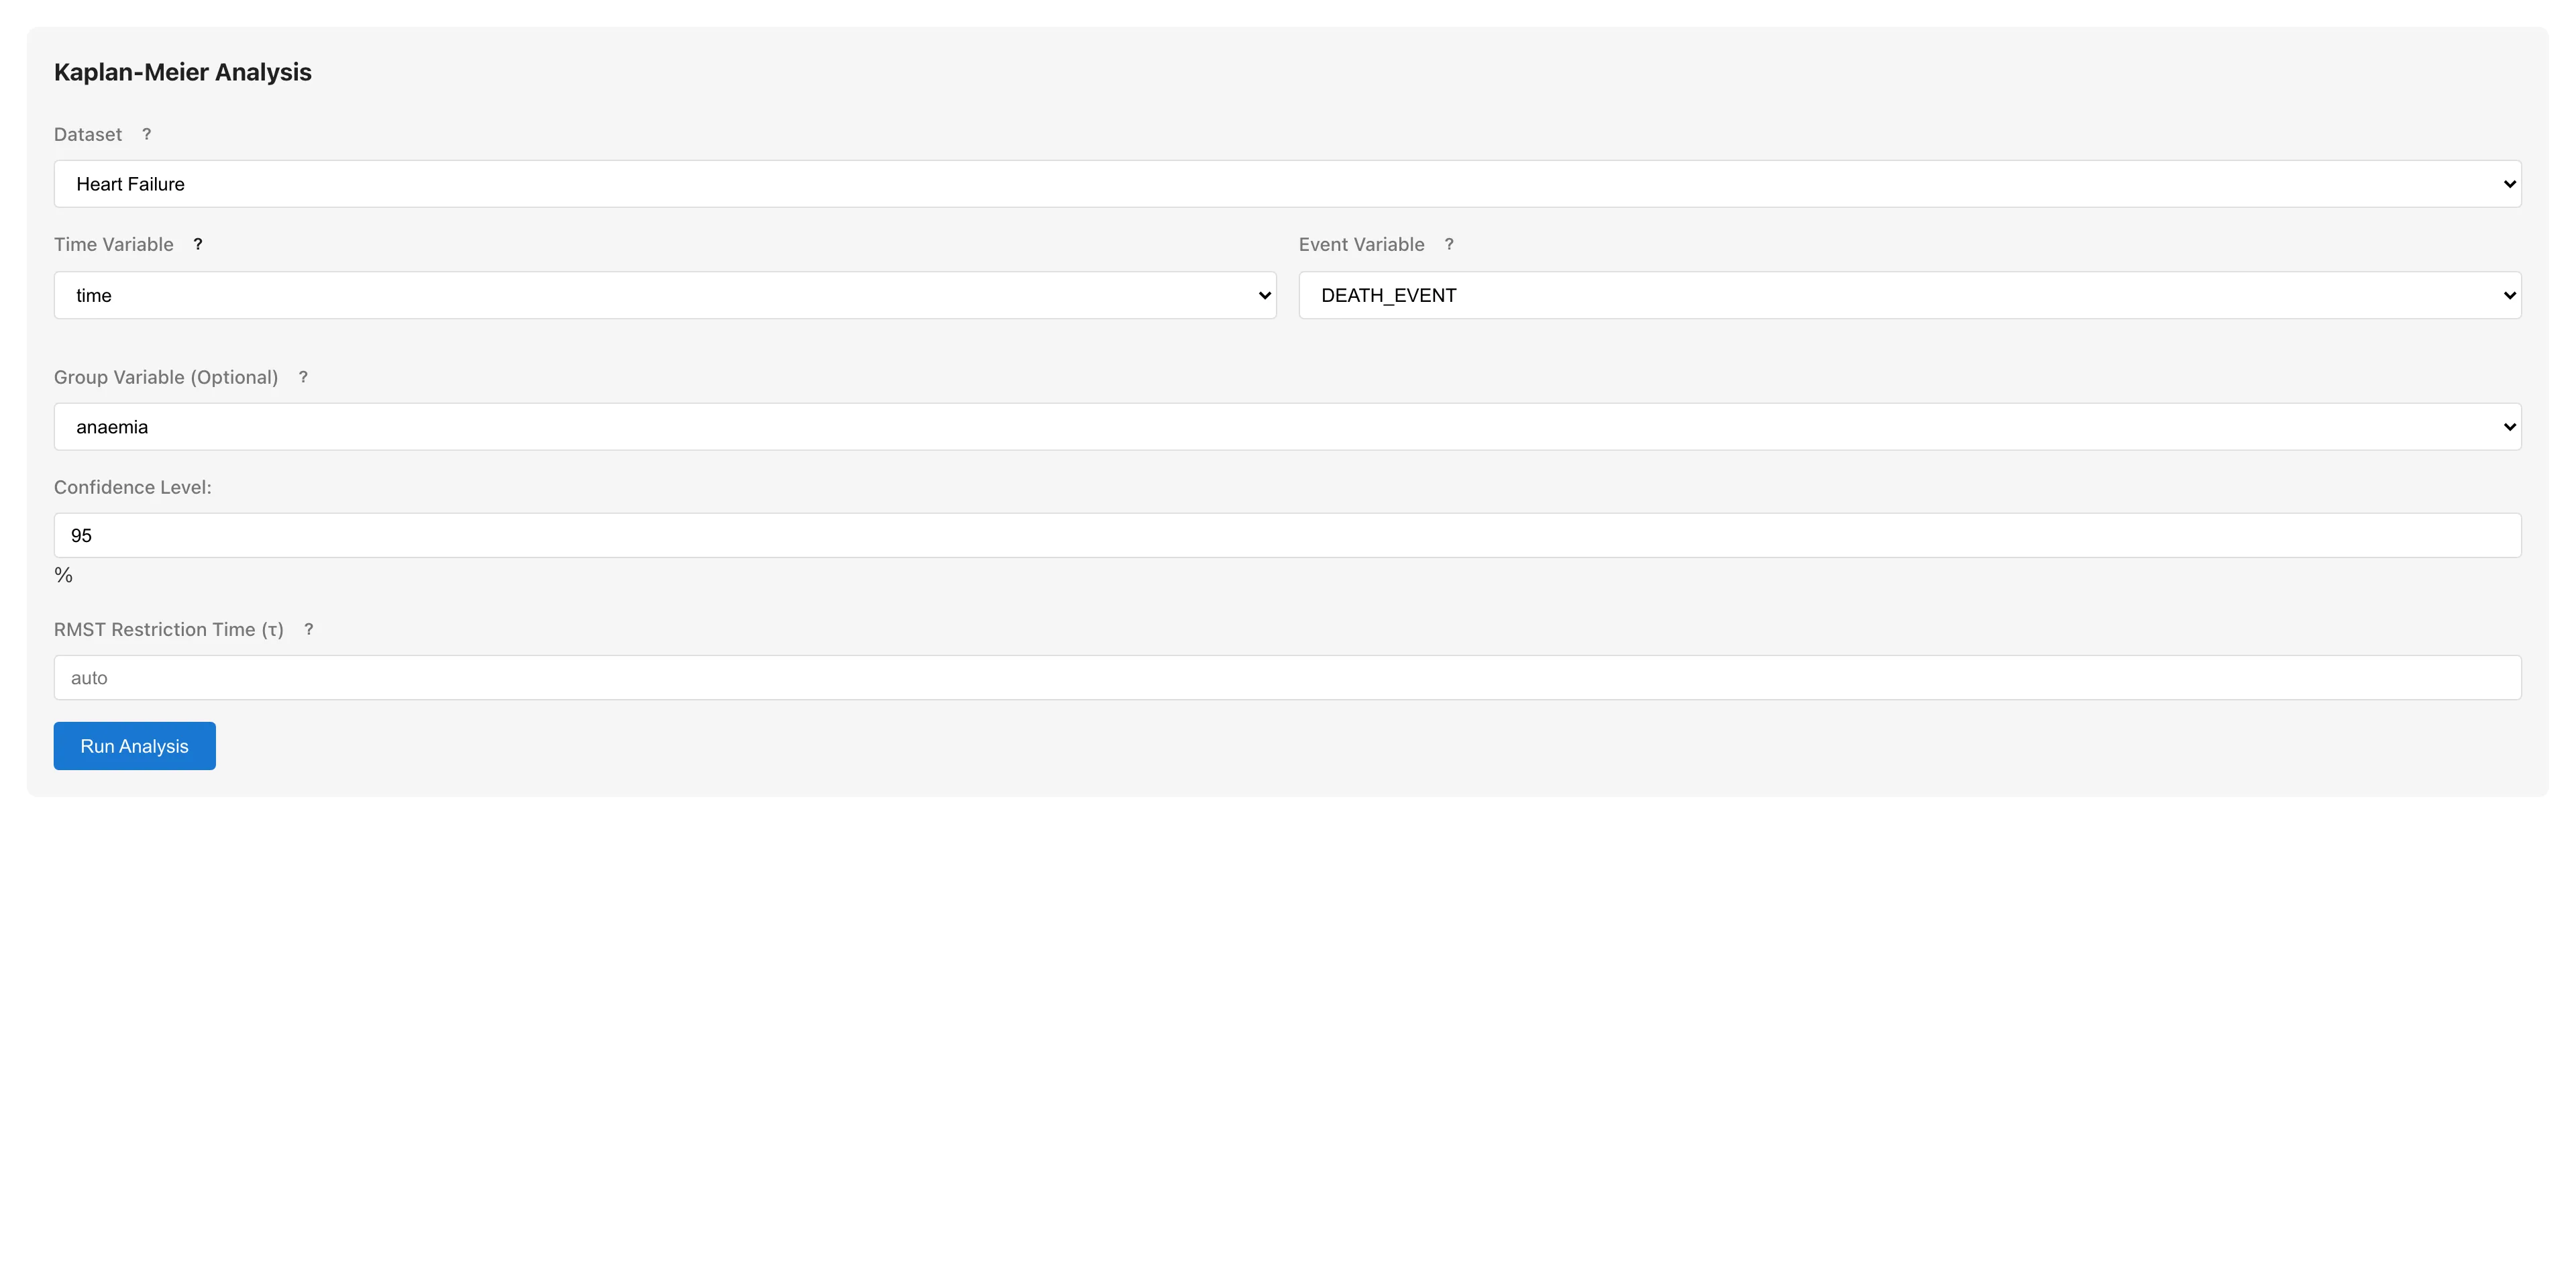
Changing the variable selection, Confidence Level, or the RMST restriction time after a run makes the displayed results no longer belong to the current settings. MIDAS removes those results from the view and shows a message asking you to run the analysis again. Restoring the previous settings brings the results back. Changing Dataset also resets the variable selection, so the results are discarded instead. The confidence level is one of the settings because the confidence intervals in Summary Statistics and RMST are computed at the level in effect at run time and there is no way to recompute them for a different level alone.
The displayed results also stop belonging to the current data when the dataset used for the analysis changes after a run. Reloading the dataset, editing cells, and changing an upstream dataset all count as such changes. MIDAS removes the results from the view and shows a message saying the dataset was modified. In this case there is no setting to restore, so run the analysis again to get results for the current data.
Understanding Results
Survival Curve
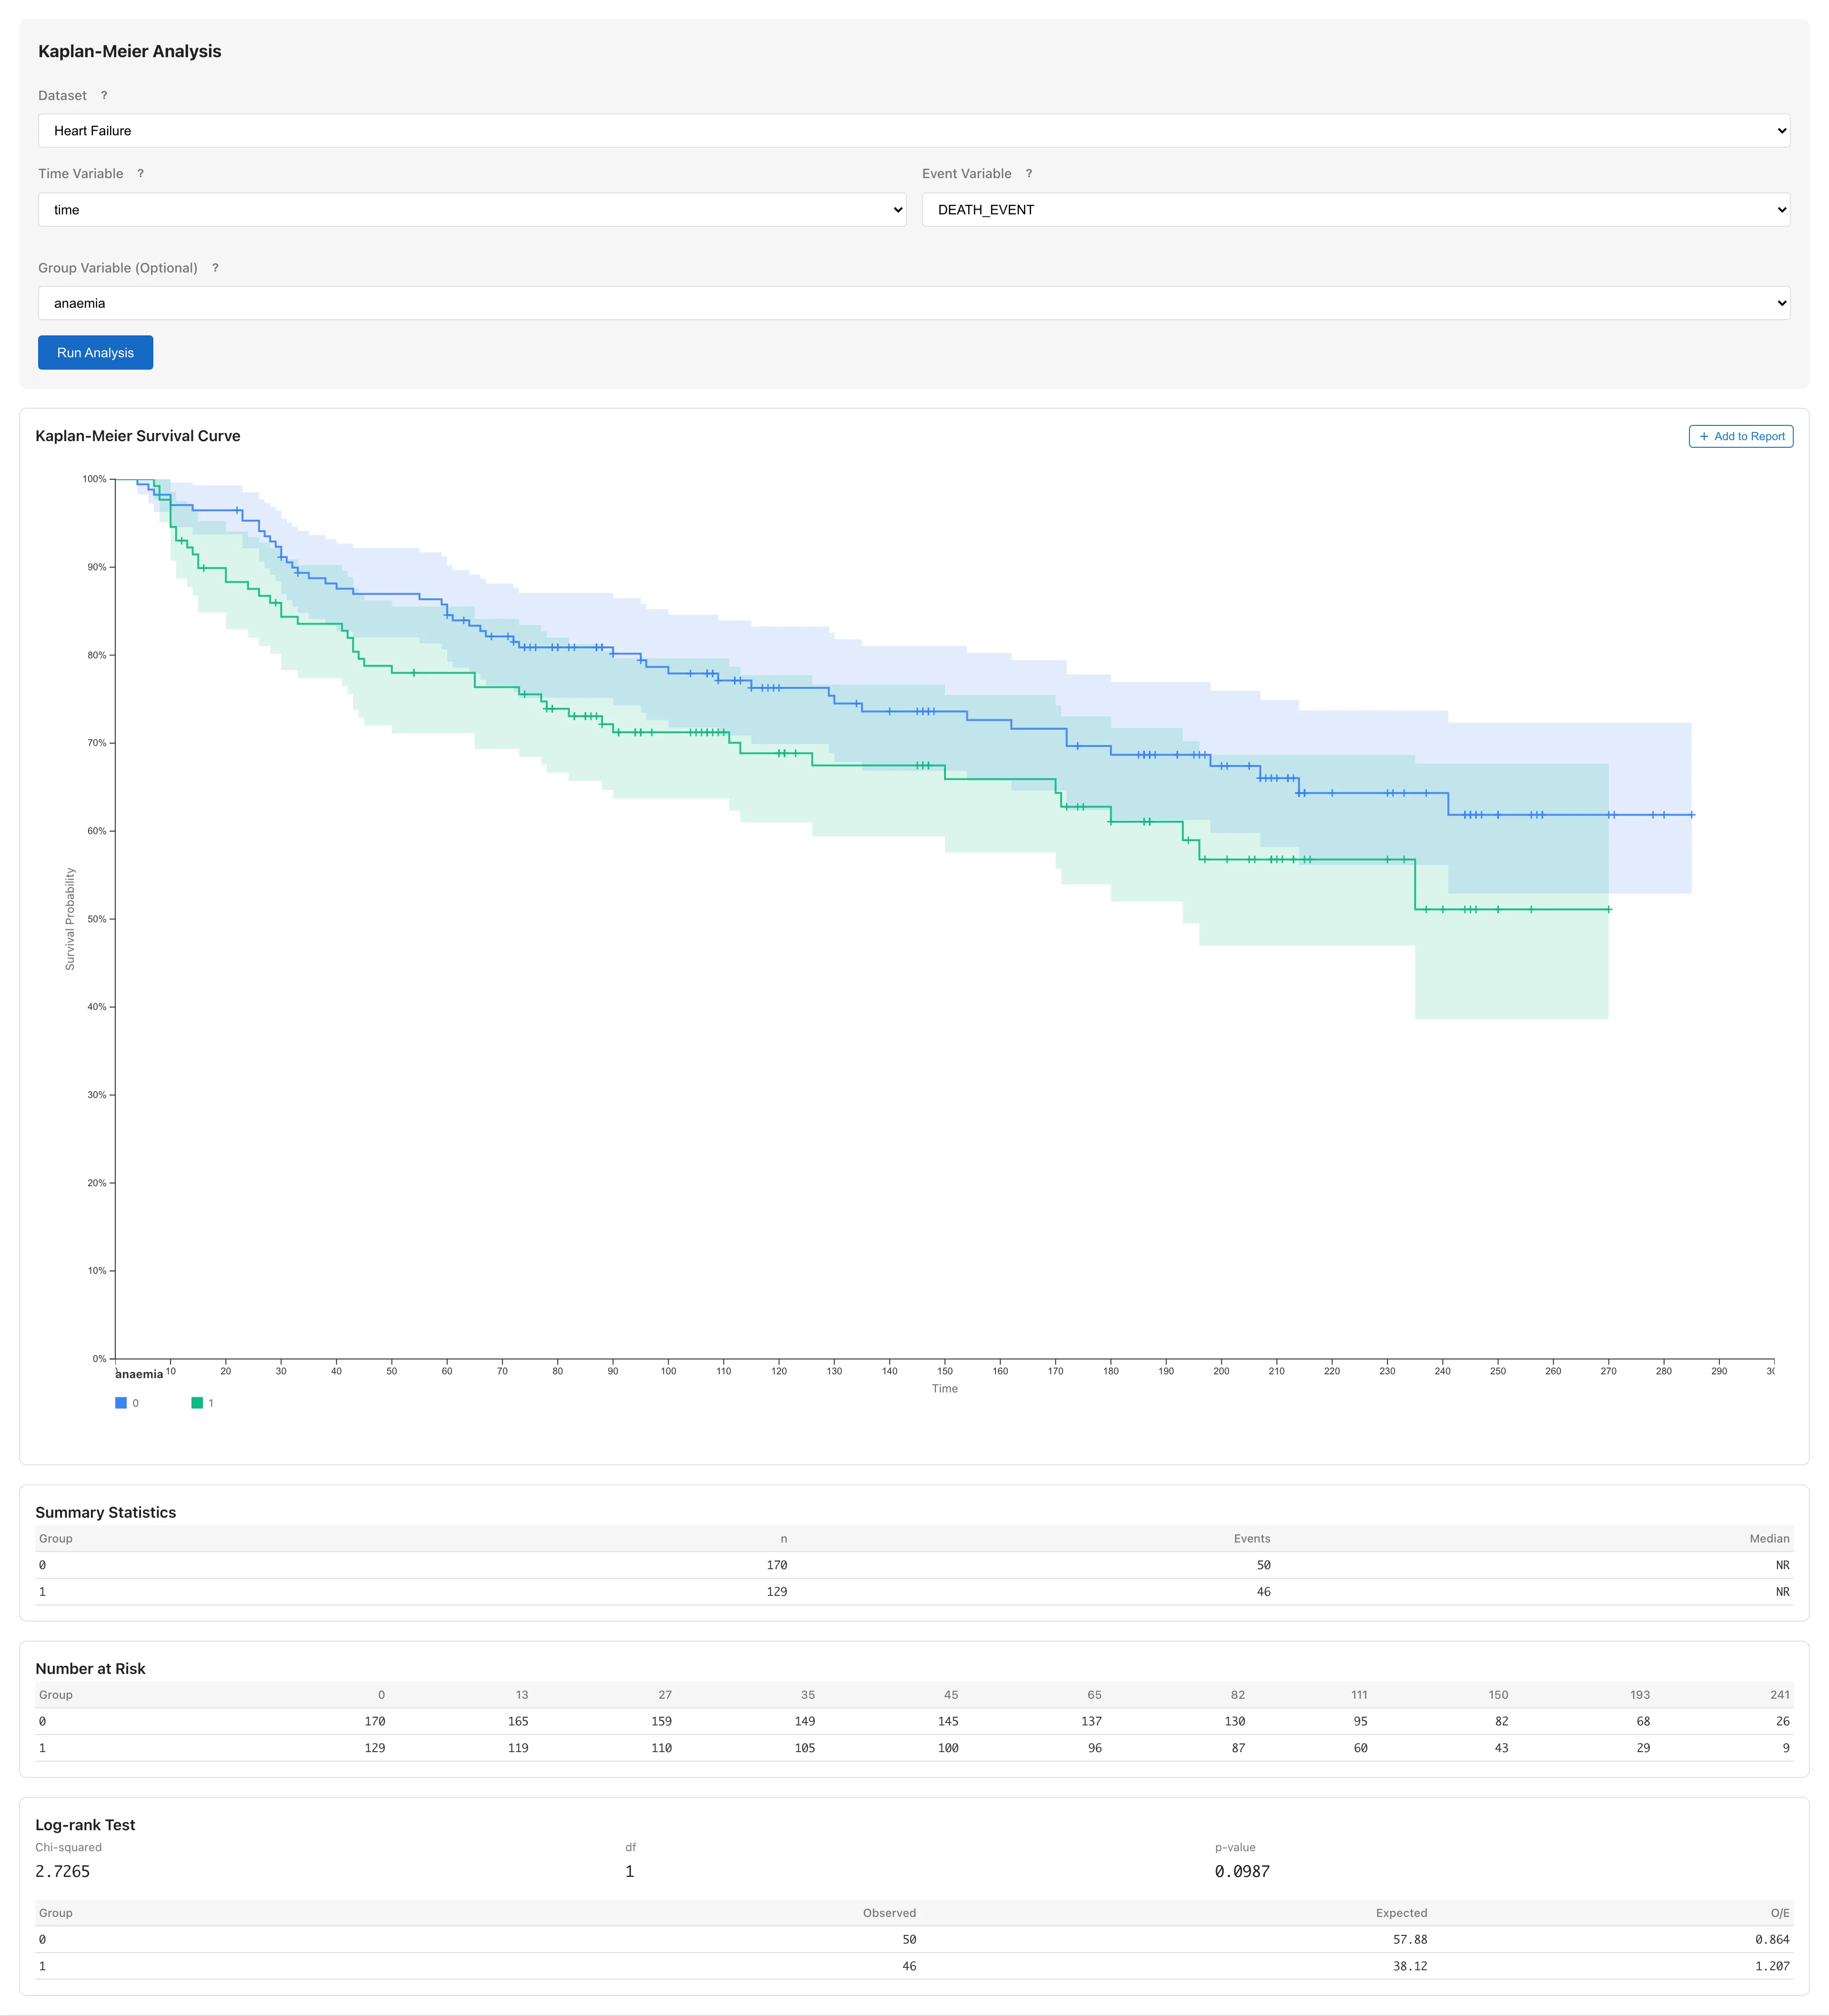
Plots survival probability against time. Displayed as a step function that decreases at each event time. Censoring times are marked with a + symbol on the curve. A + mark on a flat segment indicates that subjects were lost to follow-up during that interval. A pointwise confidence band (95% by default) is shown. A pointwise band consists of individual intervals at each time point and does not guarantee simultaneous coverage of the entire curve, computed using the log transformation method (details).
Adjust the confidence level with the Confidence Level input. The range is 50 to 99.99, and a value outside it is moved to the nearer end when the input loses focus. Changing it after a run removes the results from the view until you run the analysis again (see Basic Usage).
Summary Statistics
| Column | Description |
|---|---|
| Group | Group name (when Group Variable is specified) |
| n | Number of observations |
| Events | Number of events |
| Median | Median survival time, the earliest time when . Displayed as NR (Not Reached) if not reached within the observation period |
| nn% CI | Confidence interval for the median, obtained by inverting the pointwise confidence band of the survival function. A bound is displayed as NR when the corresponding survival CI bound does not cross |
Number at Risk
Shows the risk set size (the number of subjects who have not yet experienced the event and have not been censored) at each time point.
RMST (Restricted Mean Survival Time)
The average survival time estimated as the area under the Kaplan-Meier curve from 0 to a restriction time (formulation). Per-group RMST with SE and confidence interval is displayed.
| Column | Description |
|---|---|
| Group | Group name |
| RMST | Restricted mean survival time estimate |
| SE | Standard error (Greenwood variance-based) |
| nn% CI | Confidence interval for RMST (Wald-type) |
For a group with no event times at or before , MIDAS does not estimate RMST and displays "-" for RMST, SE, and the confidence interval. In this case the estimate degenerates to a point estimate equal to with a zero-width confidence interval, which cannot express the uncertainty of the estimate. Pairwise differences involving such a group are displayed as "-" as well.
Restriction Time
RMST is the area under the KM curve up to , so the choice of affects the result. The default is the upper bound of the range commonly observed across all groups (the smallest of each group's maximum observed time). Change it with the RMST Restriction Time input. Leaving the input empty uses the default. After a run, the empty input shows that default in faint text. Values of 0 or below are not accepted, and the input shows a note. Changing it after a run removes the results from the view until you run the analysis again (see Basic Usage). In the interval after the last observed event, the integration assumes the KM curve stays at its last value (this also happens within the maximum observed time when only censoring follows the last event). The longer this interval, the more the uncertainty of RMST may be underestimated.
Group Differences
When a Group Variable is specified and there are two or more groups, pairwise RMST differences and their confidence intervals are displayed. For three or more groups, the per-pair confidence intervals are unadjusted for multiplicity.
Notes
- Rows with missing values in the time or event variable are automatically excluded (listwise deletion; see Missing Data Mechanisms for validity conditions). When rows are excluded, the results show the number of excluded rows as "N rows excluded due to missing values."
Adding to Reports
Click Add to Report to add the survival curve to a report.
See also
- Survival Analysis Fundamentals - Mathematical background of time-to-event data, Kaplan-Meier, and Cox model
- The Cox Regression Tab - Estimating the effect of covariates on hazard
- Tutorial: Kaplan-Meier Analysis - A practical example with sample data
Also available as a Markdown file.