Selected Rows
The Selected Rows tab displays rows you have selected via row selection. Use it to review selected rows or save them as a derived dataset.
Where It Appears
When you open a project with the Three Pane Analysis layout, a Selected Rows tab is automatically created in the bottom-right pane. If you use a different layout or close the tab, you can reopen it from View > Selected Rows in the menu bar, the + button in a pane, or the Command Palette (Ctrl/Cmd+P).
When no rows are selected, the tab shows "No Rows Selected". Select rows in Data Table, Graph Builder, Statistics, or other tabs to see them here.
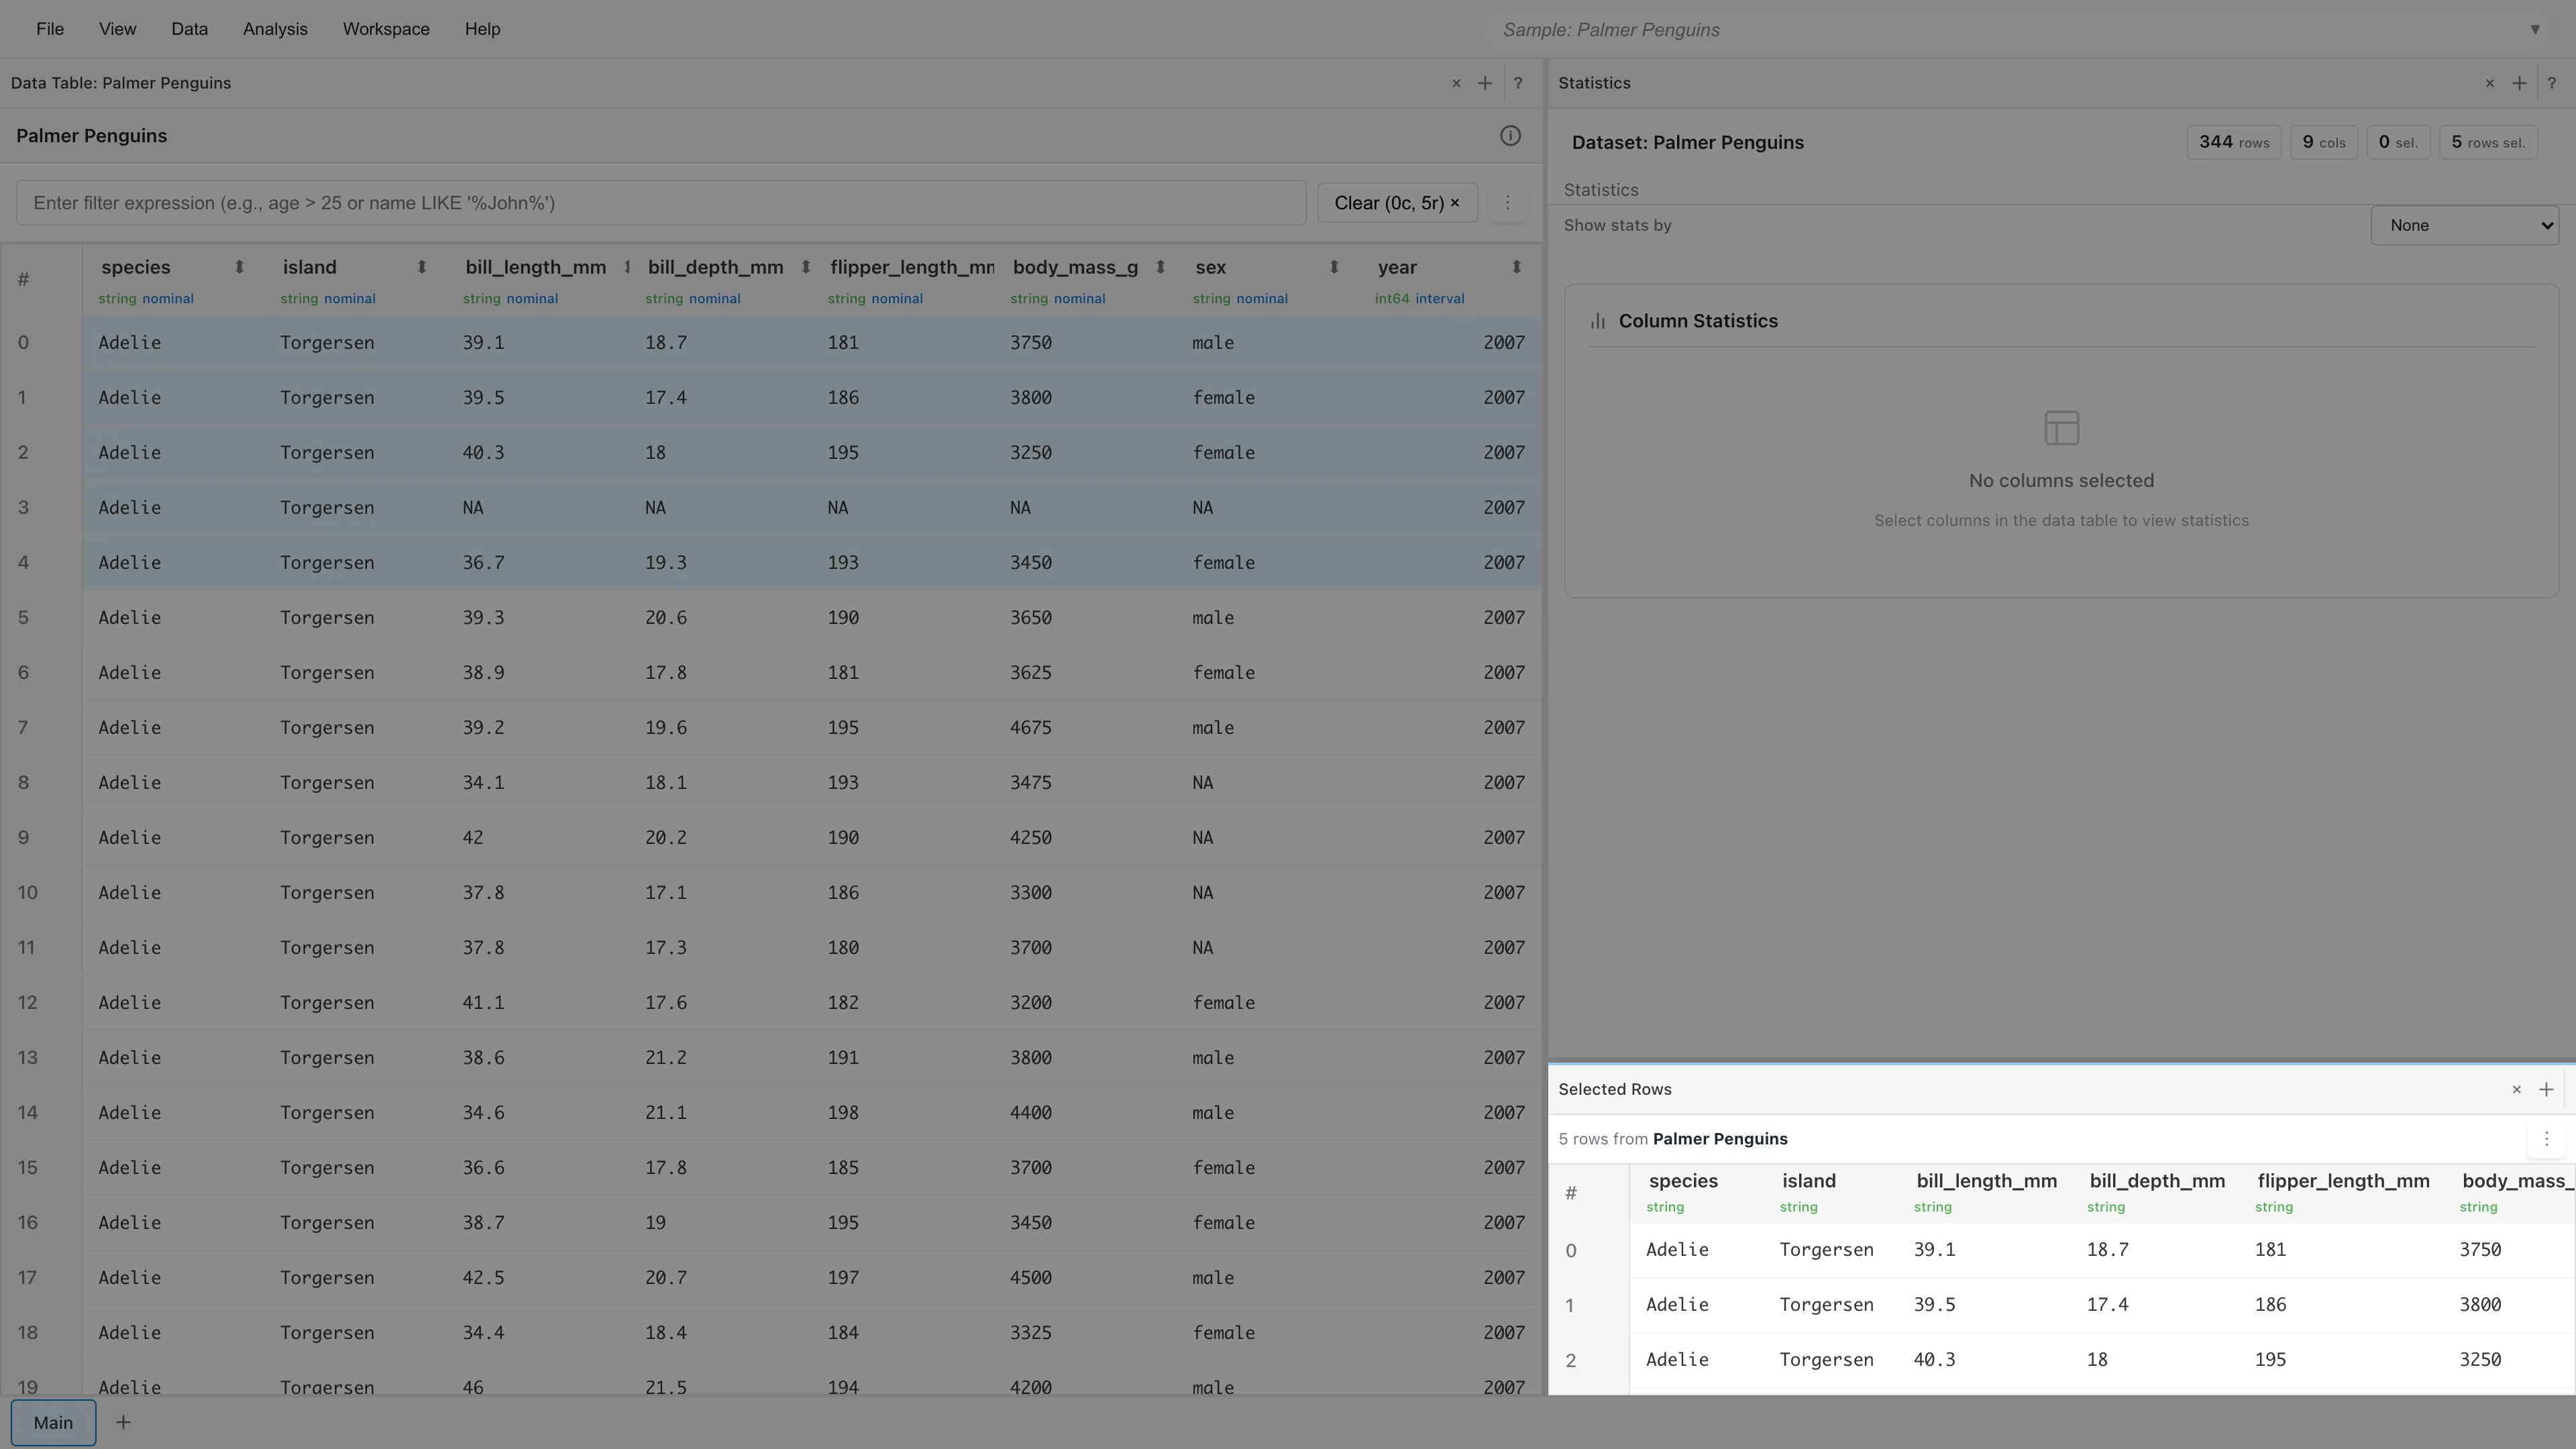
What It Shows
The header displays the number of selected rows and the dataset name. The Clear rows button at the right side of the header clears the current row selection (column selection is preserved); it is disabled when no rows are selected. A menu button (⋮) is always shown immediately right of the Clear rows button. Which items appear in the menu depends on the selection state; see Actions.
Below the header is a table containing only the selected rows.
When you select rows by clicking a graph bar or histogram bin, or by rectangle selection in Select mode, a selection expression is shown below the table. For example, clicking a histogram bin might show 35 <= bill_length_mm AND bill_length_mm < 40. Manually clicking rows in the Data Table does not produce an expression.
Actions
Open the menu button (⋮) to see the available actions. Save as Dataset is always present and becomes active when rows are selected. Open as Filtered Data appears in the menu only when a selection expression exists.
Open as Filtered Data -- Opens the currently selected rows in a new Filtered Data tab, using the selection expression as the filter condition. This menu item appears for selections that carry an expression, such as clicking a graph bar or histogram bin, or rectangle selection in Select mode. Rows selected by manual clicks in Data Table do not produce an expression, so this item is not shown for them. To save manually selected rows, use Save as Dataset.
Save as Dataset -- Saves the selected rows as a derived dataset. Enter a dataset name in the dialog to save. The derived dataset references the source data by row index. If you reload the dataset from a CSV file, it returns rows at the same row numbers, so adding or reordering rows in the source may cause it to reference different data.
Workflow Example: Examine Outliers in a Scatter Plot
- Create a scatter plot in Graph Builder
- Click data points that appear to be outliers to select them
- Check the values of those rows in the Selected Rows tab
- From the menu button (⋮), choose Save as Dataset to save as a derived dataset
Differences from Filtered Data
The Selected Rows tab reflects the current selection state in real time. Clearing the selection returns it to "No Rows Selected". When saved, the derived dataset references rows by index, so reordering or adding rows in the source data may cause it to point to different data.
The Filtered Data tab is an independent tab created by double-clicking. Data remains even after clearing row selection. When saved, the derived dataset references rows by filter expression, so it returns matching rows even after the source data is updated.
| Selected Rows | Filtered Data | |
|---|---|---|
| What it shows | Currently selected rows | Rows matching a specific condition |
| When selection is cleared | Returns to "No Rows Selected" | Tab and data remain |
| Additional filtering | Not available | Enter a filter expression for further narrowing |
| Save as Dataset method | References by row index | References by filter expression |
| When source data is updated | Returns rows at the same row numbers | Re-evaluates the filter expression to return matching rows |
See also
- Filtered Data -- Tab showing rows matching a filter condition
- Row Selection -- How to select rows in each tab and how selection state is shared
- Datasets -- Details on derived datasets
- Workspace and Layout Management -- Three Pane Analysis layout
Also available as a Markdown file.