Project Lineage
Visualize how the resources in your project — datasets, reports, models, and more — relate to each other as a directed graph. For example, you can see which dataset a derived dataset was created from, and which dataset a model uses.
Opening
- File > Project Lineage
- Search "Project Lineage" in the command palette
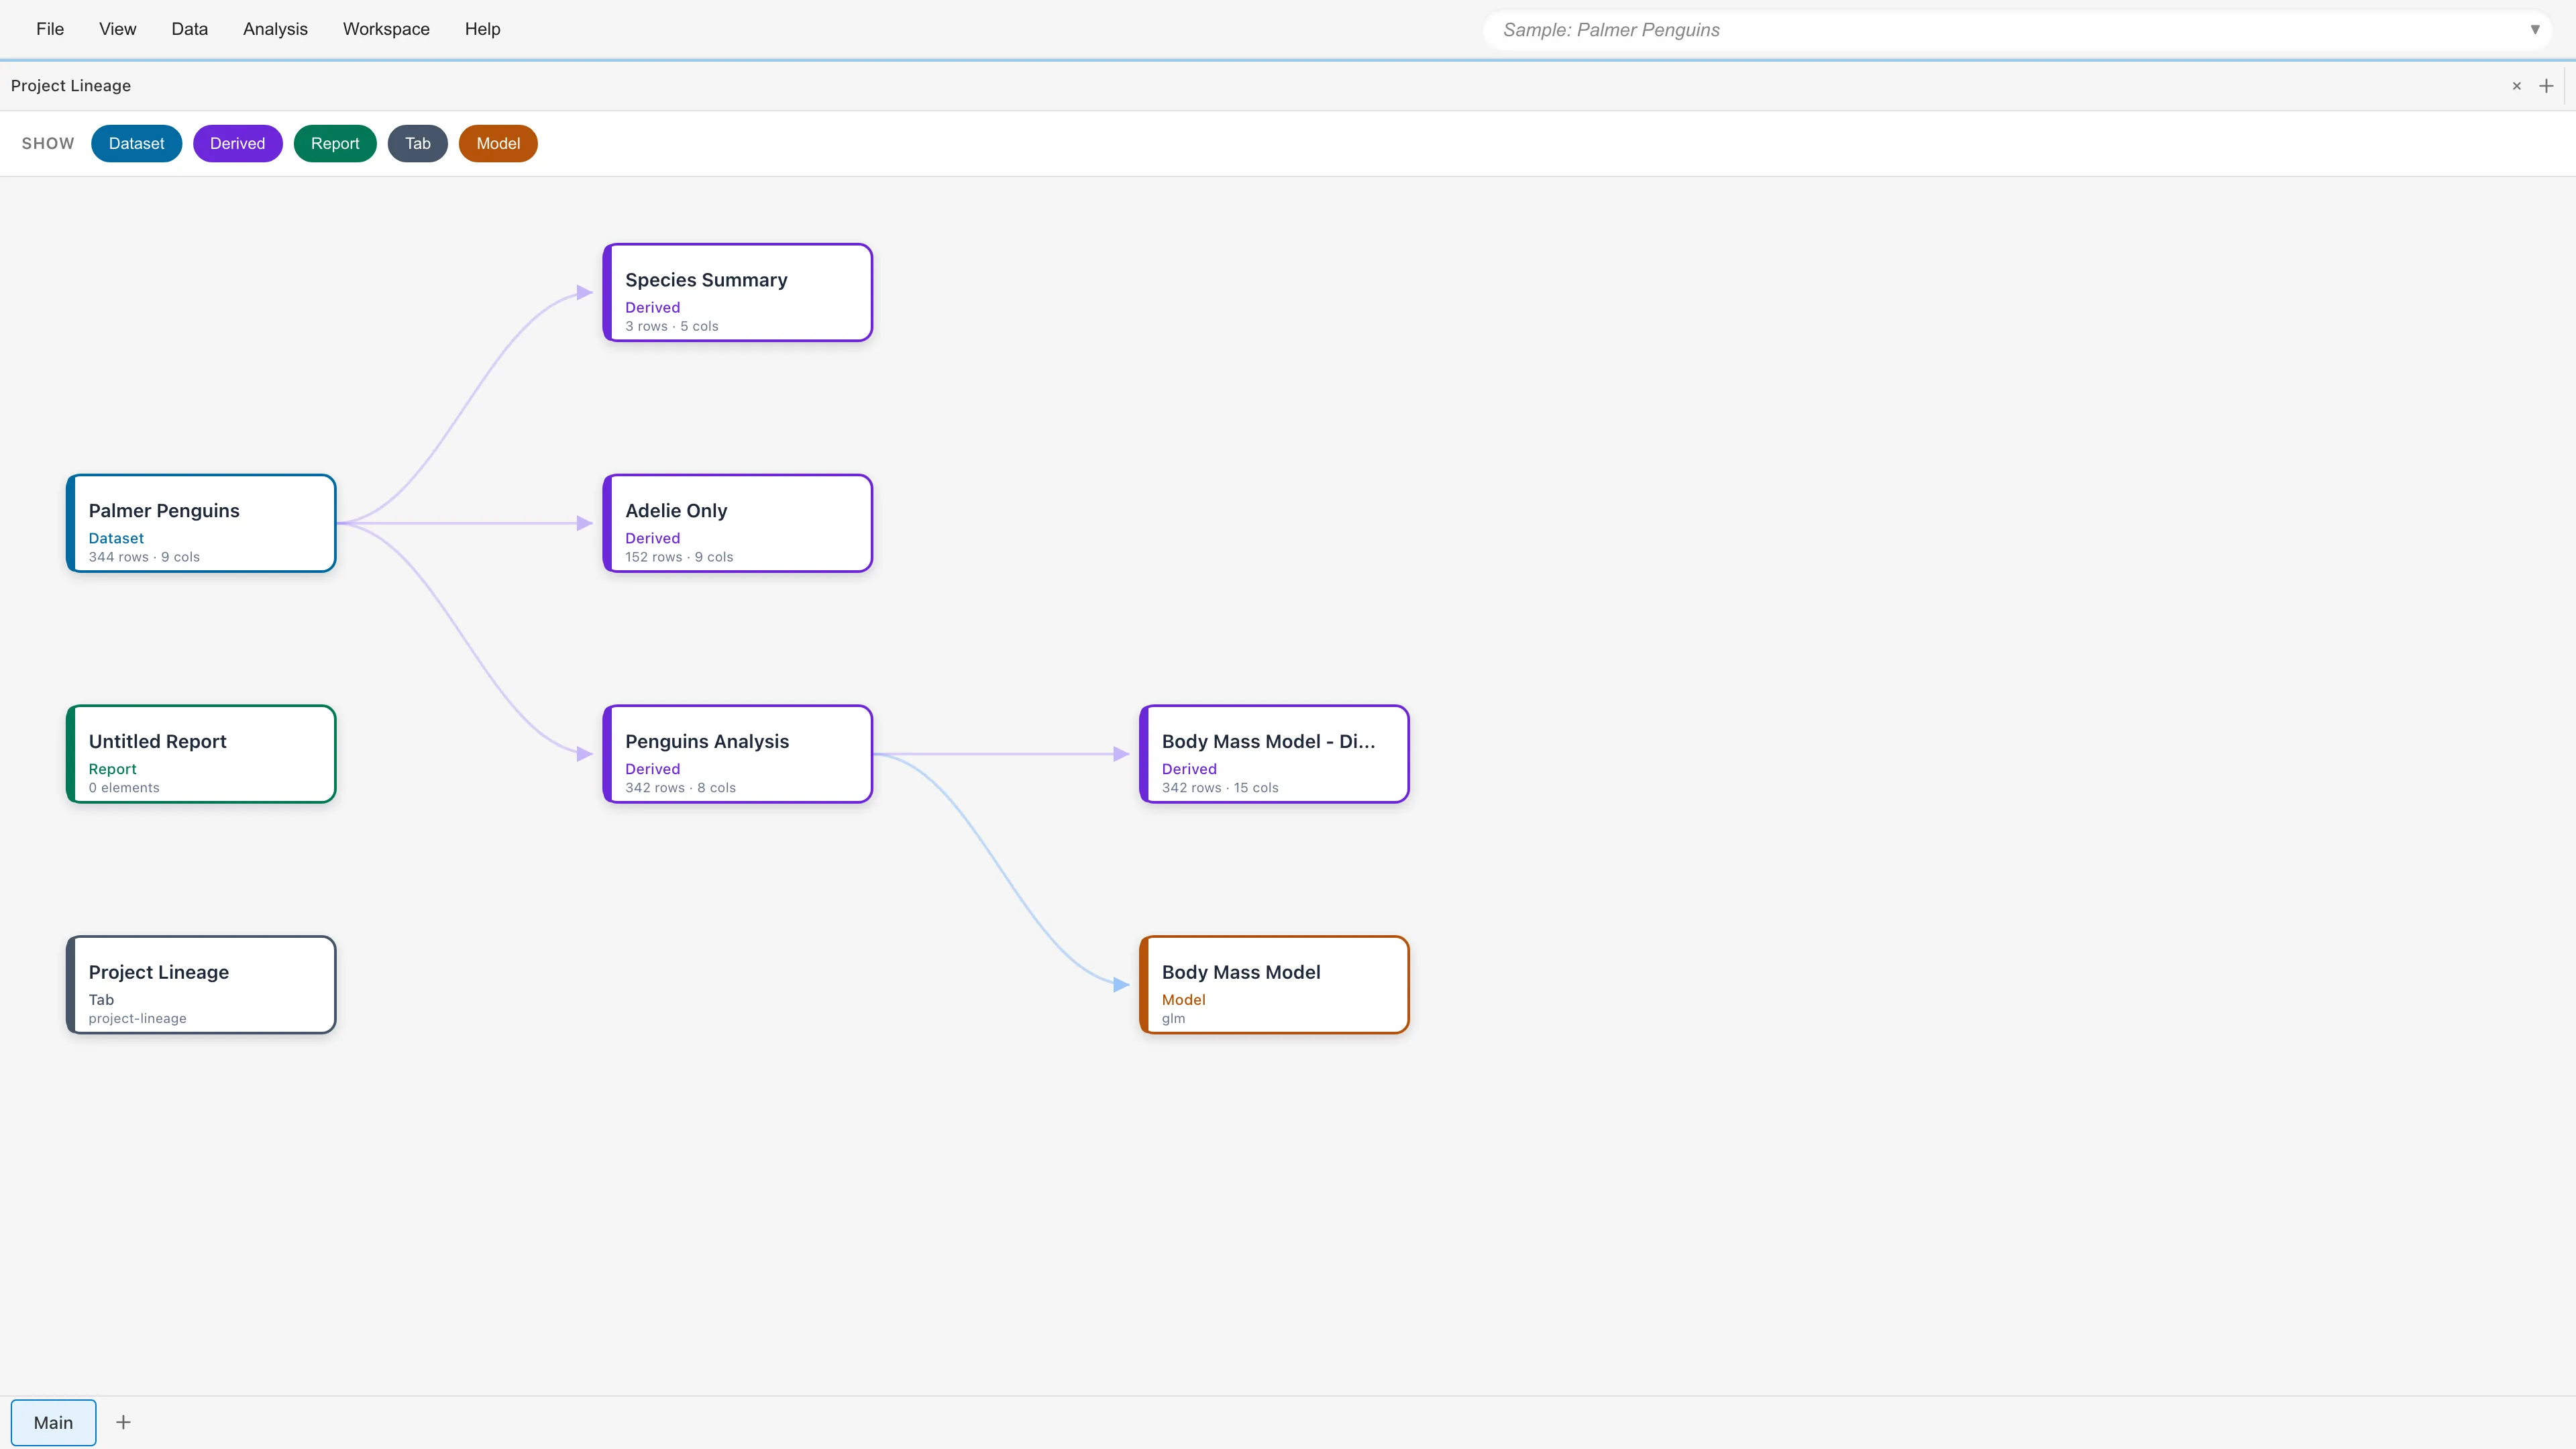
Graph View
Resources are displayed as nodes and dependencies as edges (arrows). An arrow A → B means B depends on A, and the arrows are color-coded into three types by the kind of dependency.
- derives-from - A derived dataset was created from a source dataset. The arrow is labeled with the transformation (SQL Query, Crosstab, and so on)
- references - A model was trained on a dataset (labeled "Trained on"), a report references a dataset or model, or an analysis tab references the dataset it operates on
- displays - A tab is displaying a dataset, report, or model
The graph is laid out left to right, with source data on the left and derived resources on the right.
Nodes are color-coded by type. Each node displays its name and type, along with additional information: row and column counts for datasets, the element count for reports, the model type for models, and the tab type and workspace name for tabs.

- Dataset - An imported original dataset
- Derived - A dataset generated by a transformation such as SQL Query or Crosstab
- Report - A report
- Tab - An open tab such as Data Table or Graph Builder. Tabs from all workspaces are included. Because tabs reference datasets, you can see which datasets are used by which tabs. Unlike other nodes, a Tab node disappears from the graph when its tab is closed
- Model - A fitted model
Filter Bar
Use the toggle buttons at the top to filter which node types are displayed. For example, hide Tab nodes to focus on dependencies between datasets. Hidden nodes and the arrows connected to them are removed from the graph. Dependencies that pass through a hidden node are not replaced by a bridging arrow, so hiding an intermediate node leaves that path disconnected in the view.
Interactions
| Action | Result |
|---|---|
| Drag | Pan the graph |
| Scroll | Zoom in/out |
| Click | Select a node and show the detail panel. All upstream (source side) and downstream (derived side) dependencies are highlighted |
| Double-click | Open the corresponding tab (activates the existing tab if one is already open) |
| Right-click | Show the context menu |
Detail Panel
Click a node to display the detail panel on the right side.
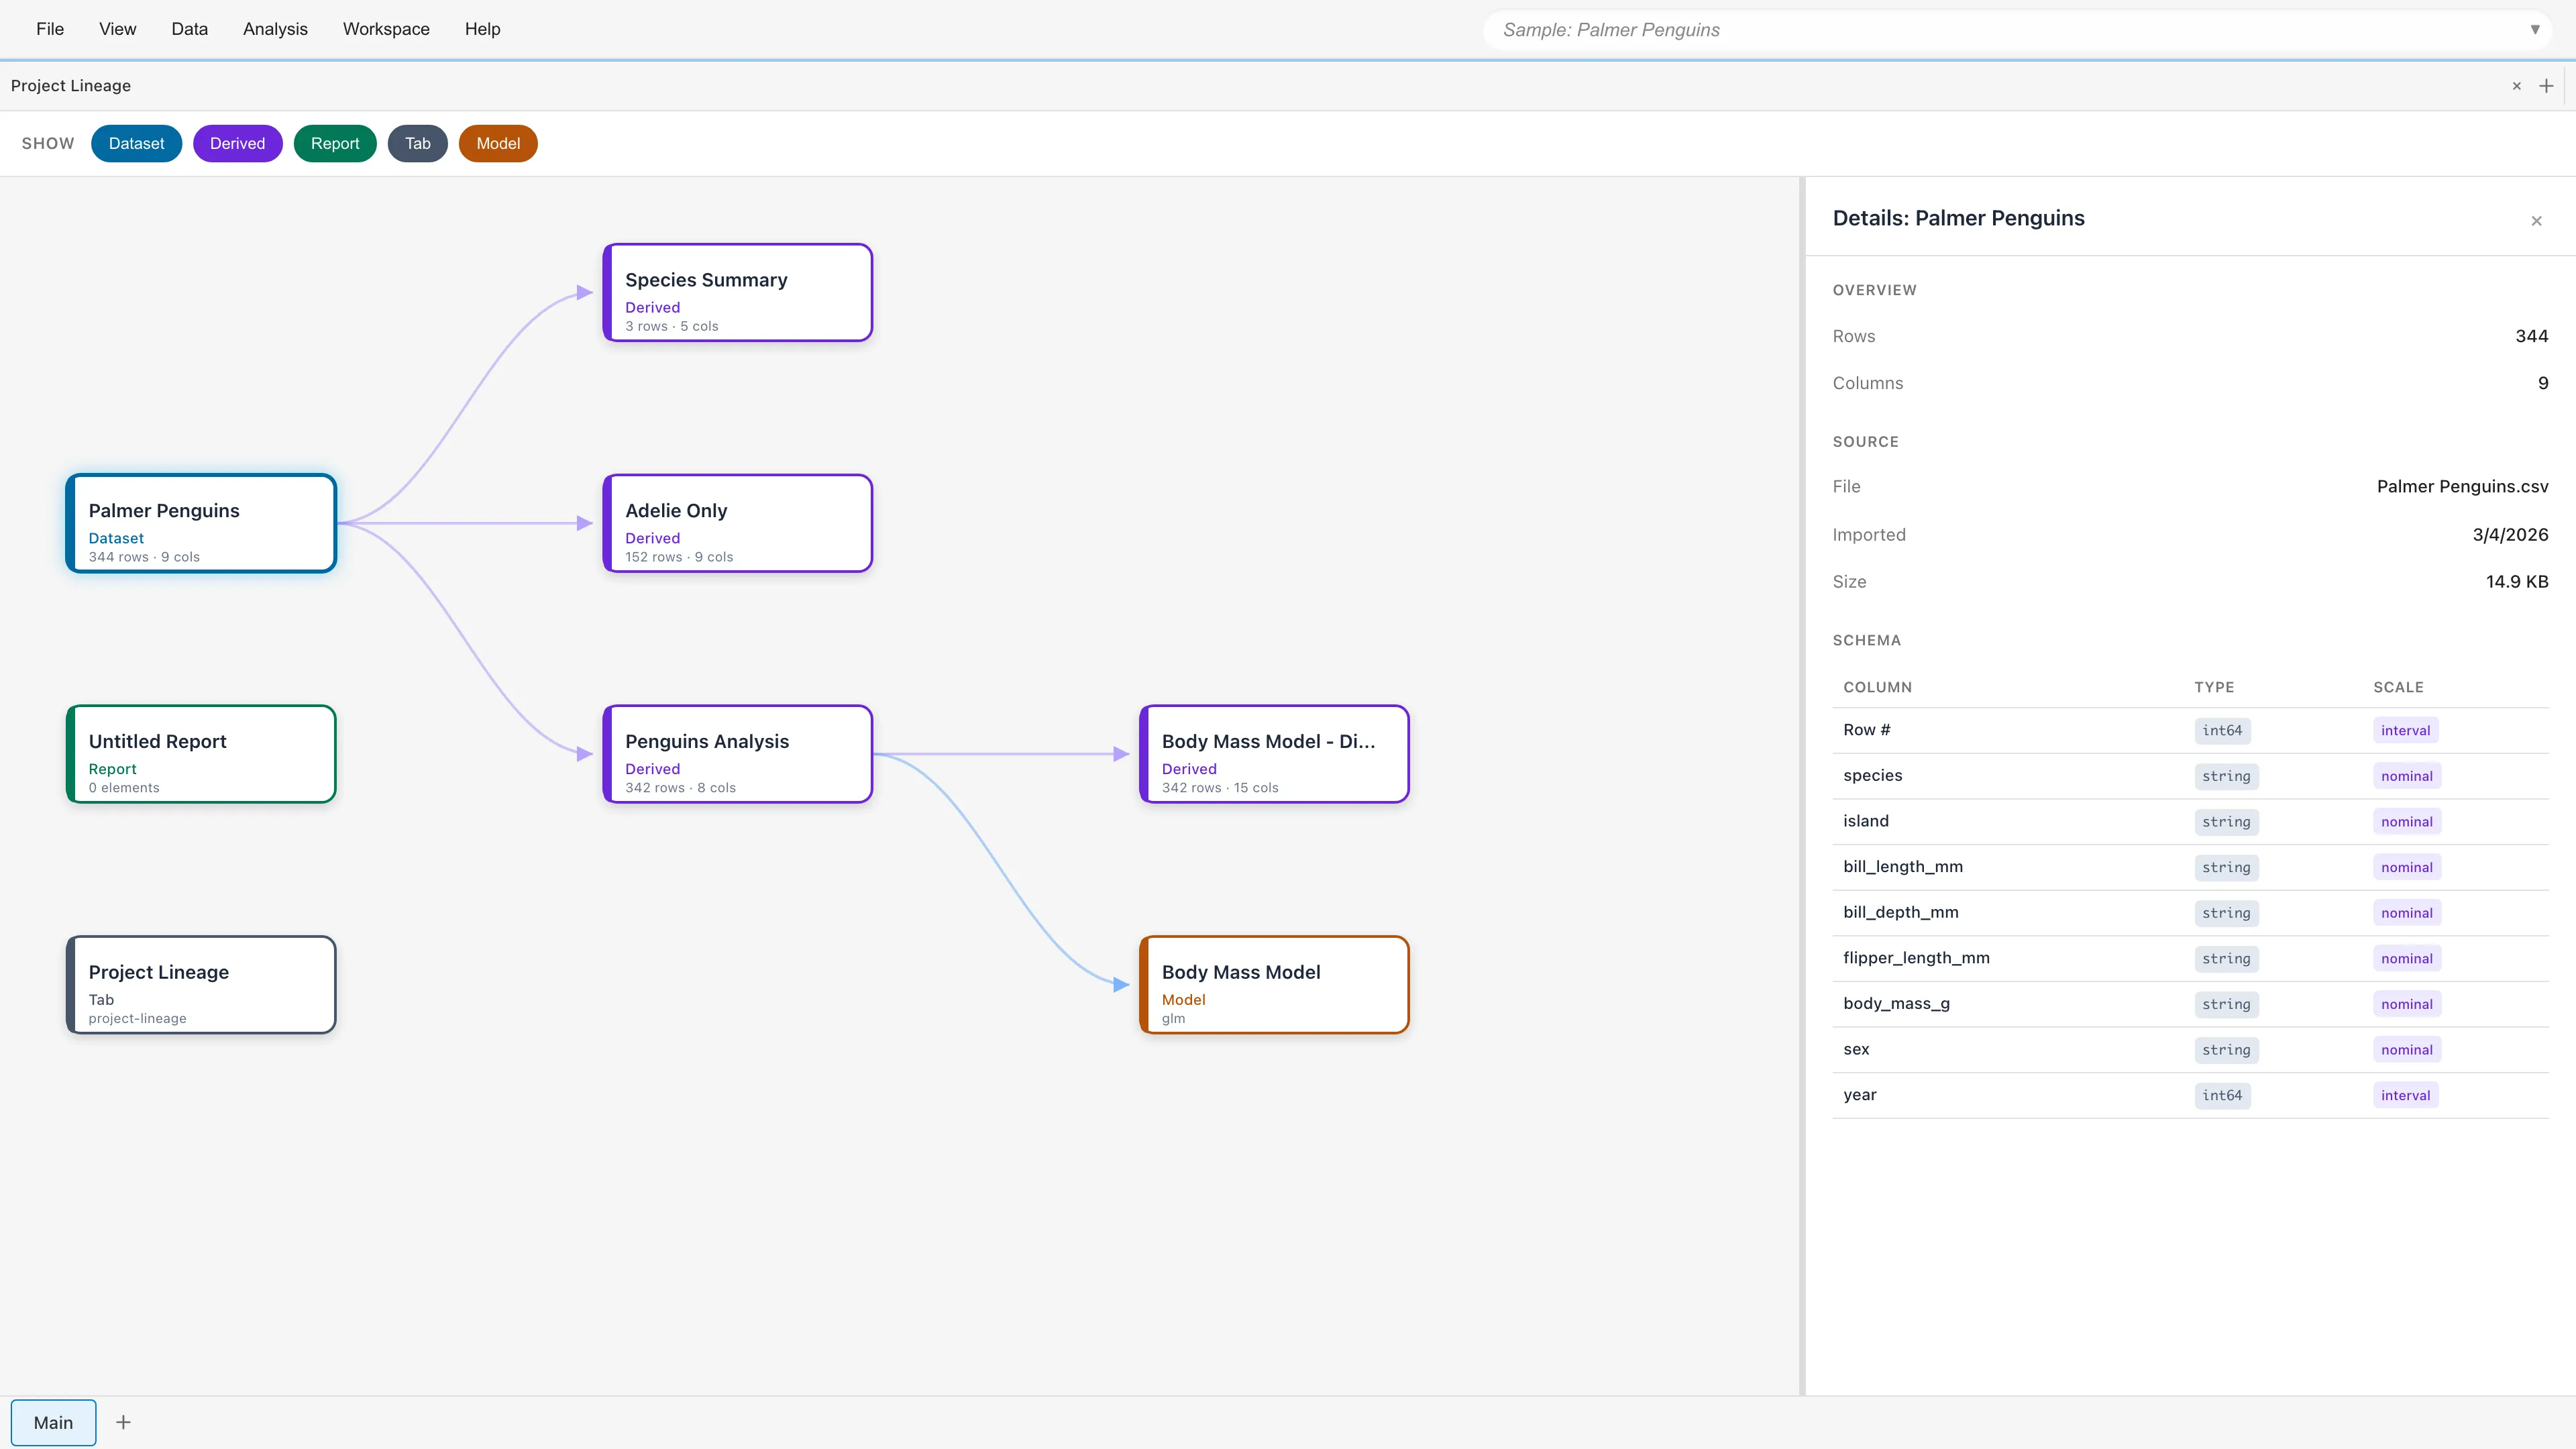
The information shown depends on the node type:
| Node Type | Information |
|---|---|
| Dataset | Overview, source, description, schema |
| Derived | Overview, description, schema, transformation (operation type; for SQL Query the query text, for Crosstab the row/column/value fields, and for Filter the filter condition are also shown) |
| Report | Element count |
| Model | Type, fitting data |
| Tab | Type, workspace, referenced resources (dataset, report, model) |
Context Menu
Right-click a node for the following actions:
- Open - Opens the node. For Tab nodes, this is displayed as Focus
- Delete - Deletes the node. If there are dependent resources, a confirmation dialog shows the affected scope. See Cascade Deletion for dataset deletion. Deleting a report closes its dependent tabs; deleting a model also removes its dependent tabs and derived datasets (such as diagnostic datasets). For Tab nodes, this is displayed as Close
- Reload Dataset... - Reloads the data for a Dataset
- Edit Operation... - Edits the transformation of a Derived Dataset. Currently only SQL Query datasets are editable. For other operation types, this item is disabled and the tooltip explains why
See also
- Project Management - Overview of project management features
- Project Overview - View and manage resources
- Compare Project - Compare the current project against an MDS file
Also available as a Markdown file.