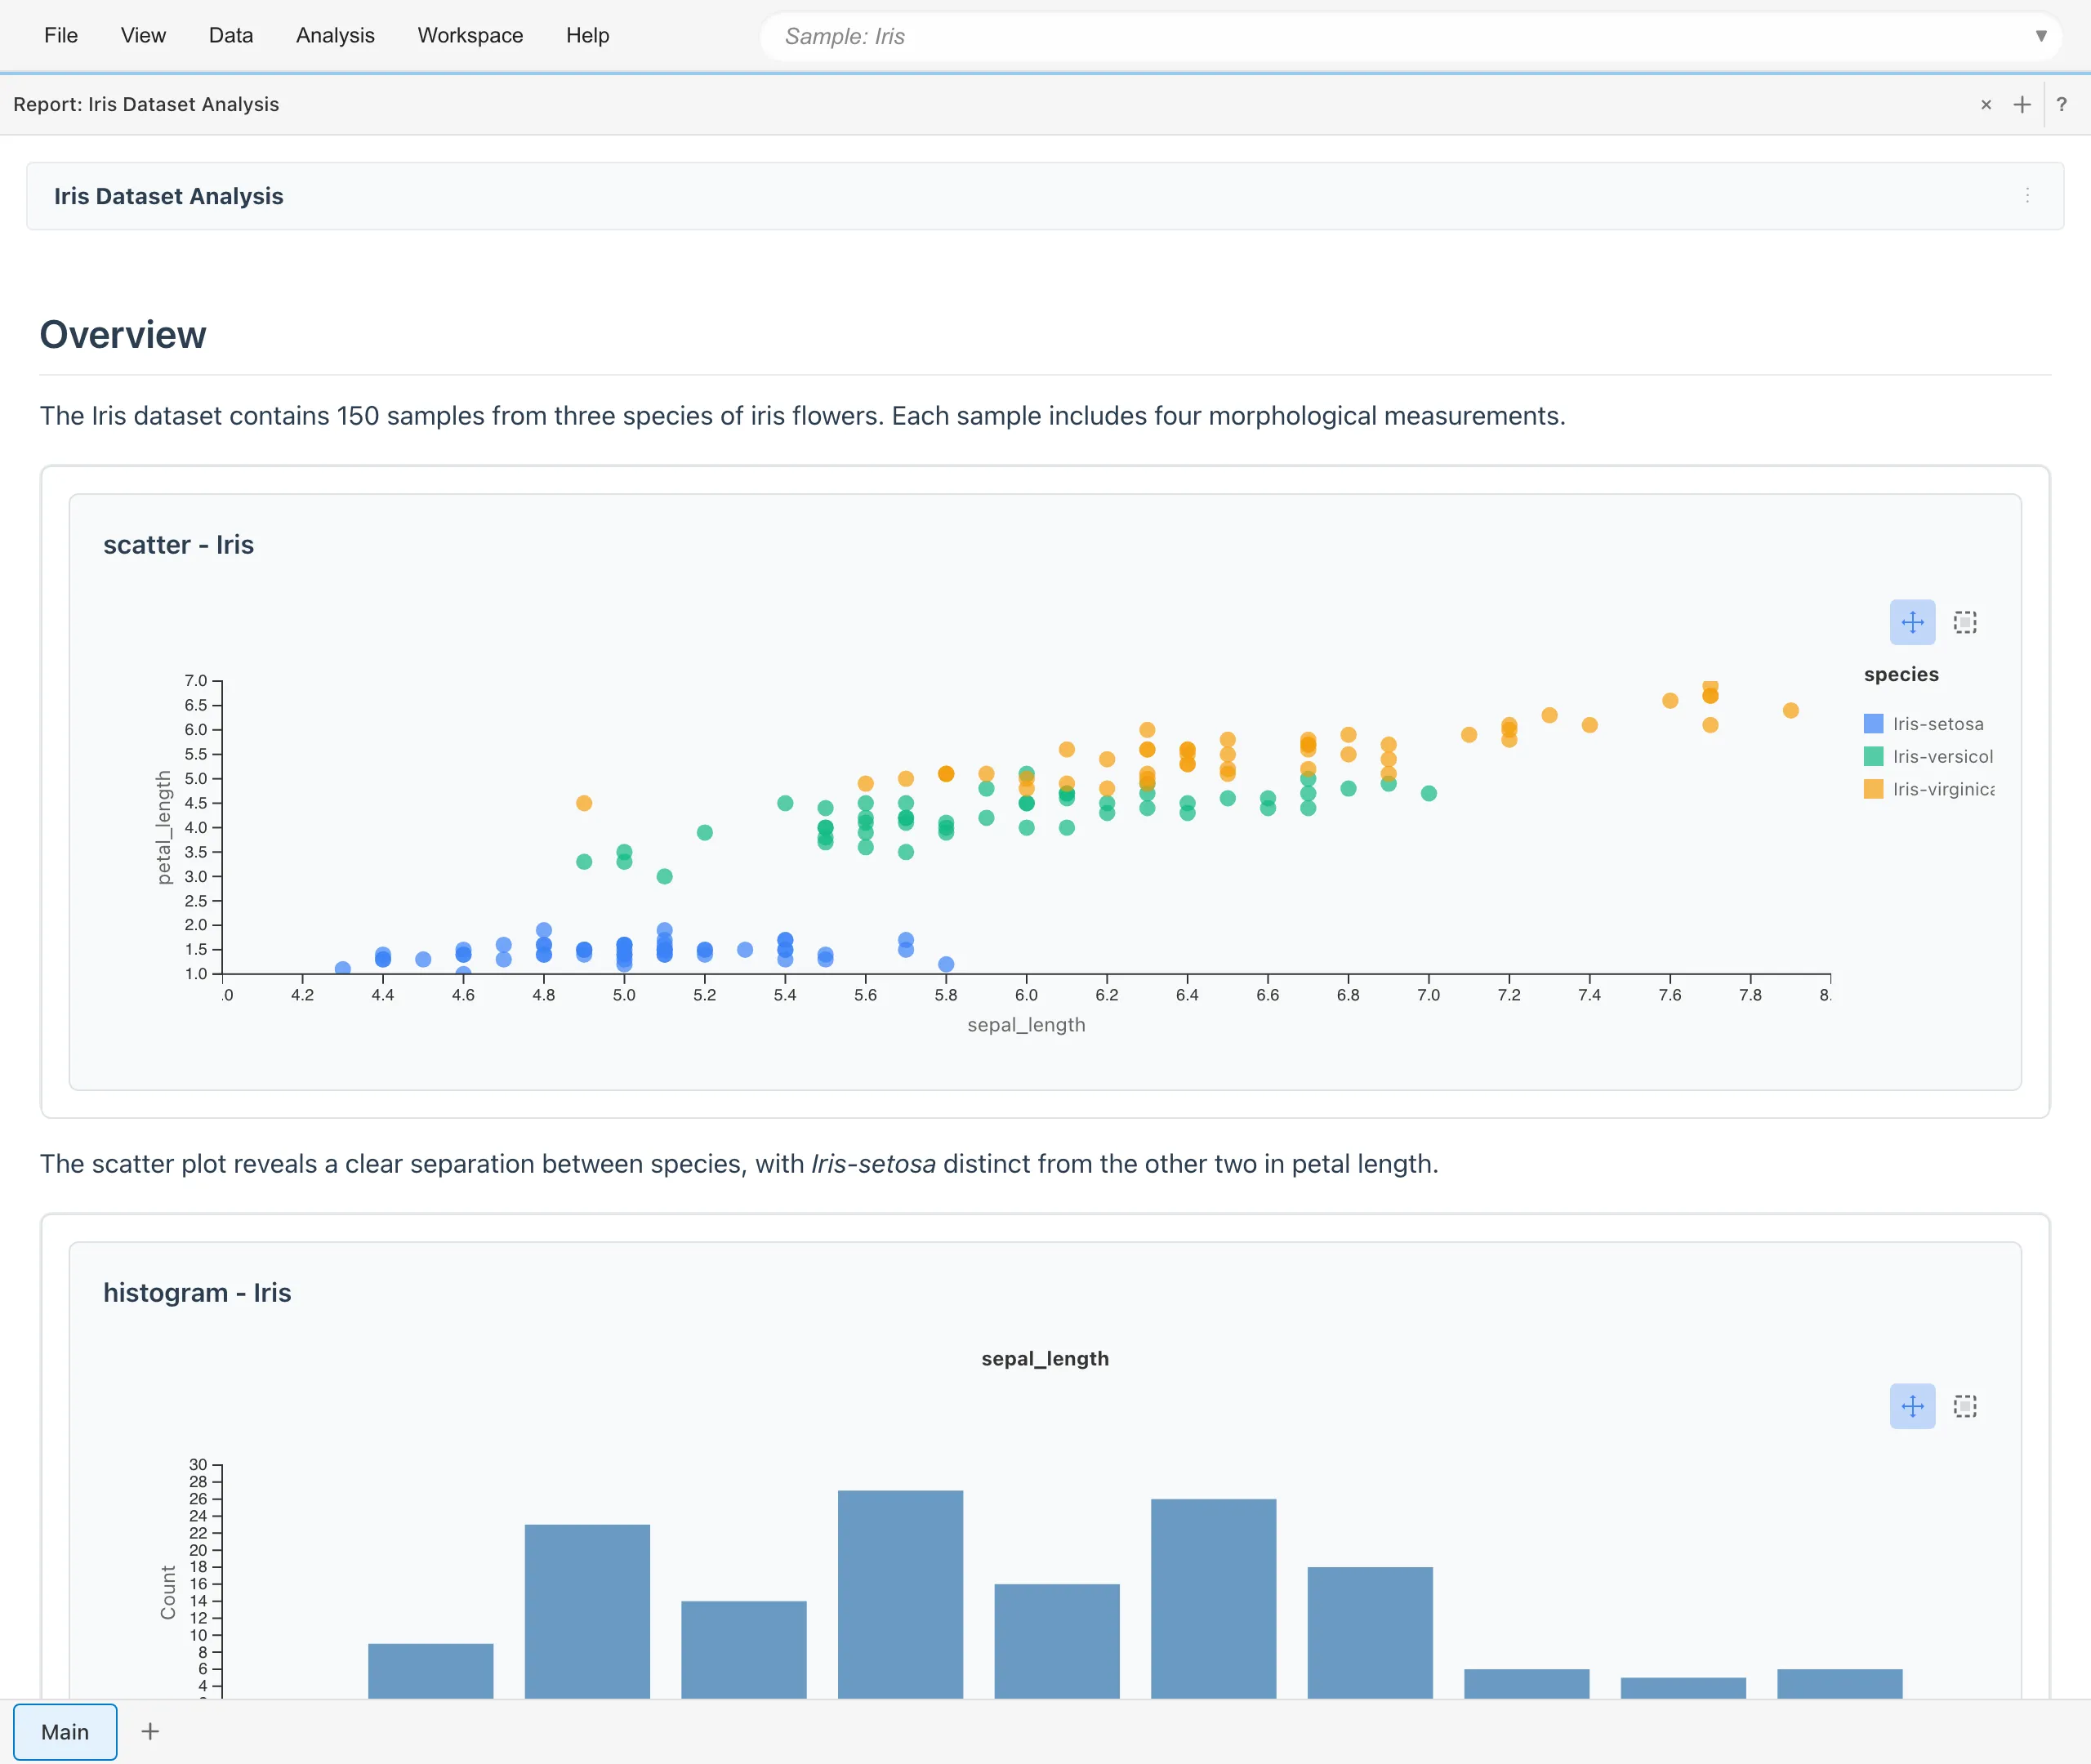
Reports
Compile your graphs and analysis results into a single document with Markdown formatting.
Creating a Report
There are two ways to create a report.
Create a New Report
Click the + button in the tab bar to open the Create New Tab dialog, then select Report. A list appears with Untitled Report at the top, followed by existing reports. Click Untitled Report to create a new report.
Create from Add to Report
Right-click on a graph in the Statistics tab and select + Create New Report from the menu to create a new report containing that graph.
Opening a Report
Click the + button in the tab bar to open the Create New Tab dialog, then select Report. The same list used for creating a new report also shows existing reports. Click a report name to open it.
Adding to Reports
Add graphs and statistical tables from various tabs to your reports. The way to add depends on the tab.
- Graph Builder: Use the Add to Report button below the preview
- Statistics: Use the ⋮ menu at the right end of each section header, or right-click a graph
- Regression analysis: Right-click the results area and select from the menu
- Data Table: Use Add to Report in the table menu
- Crosstab, ANOVA, survival analysis, PCA, DoE Analysis, and Model Detail: Use the Add to Report button in the results area
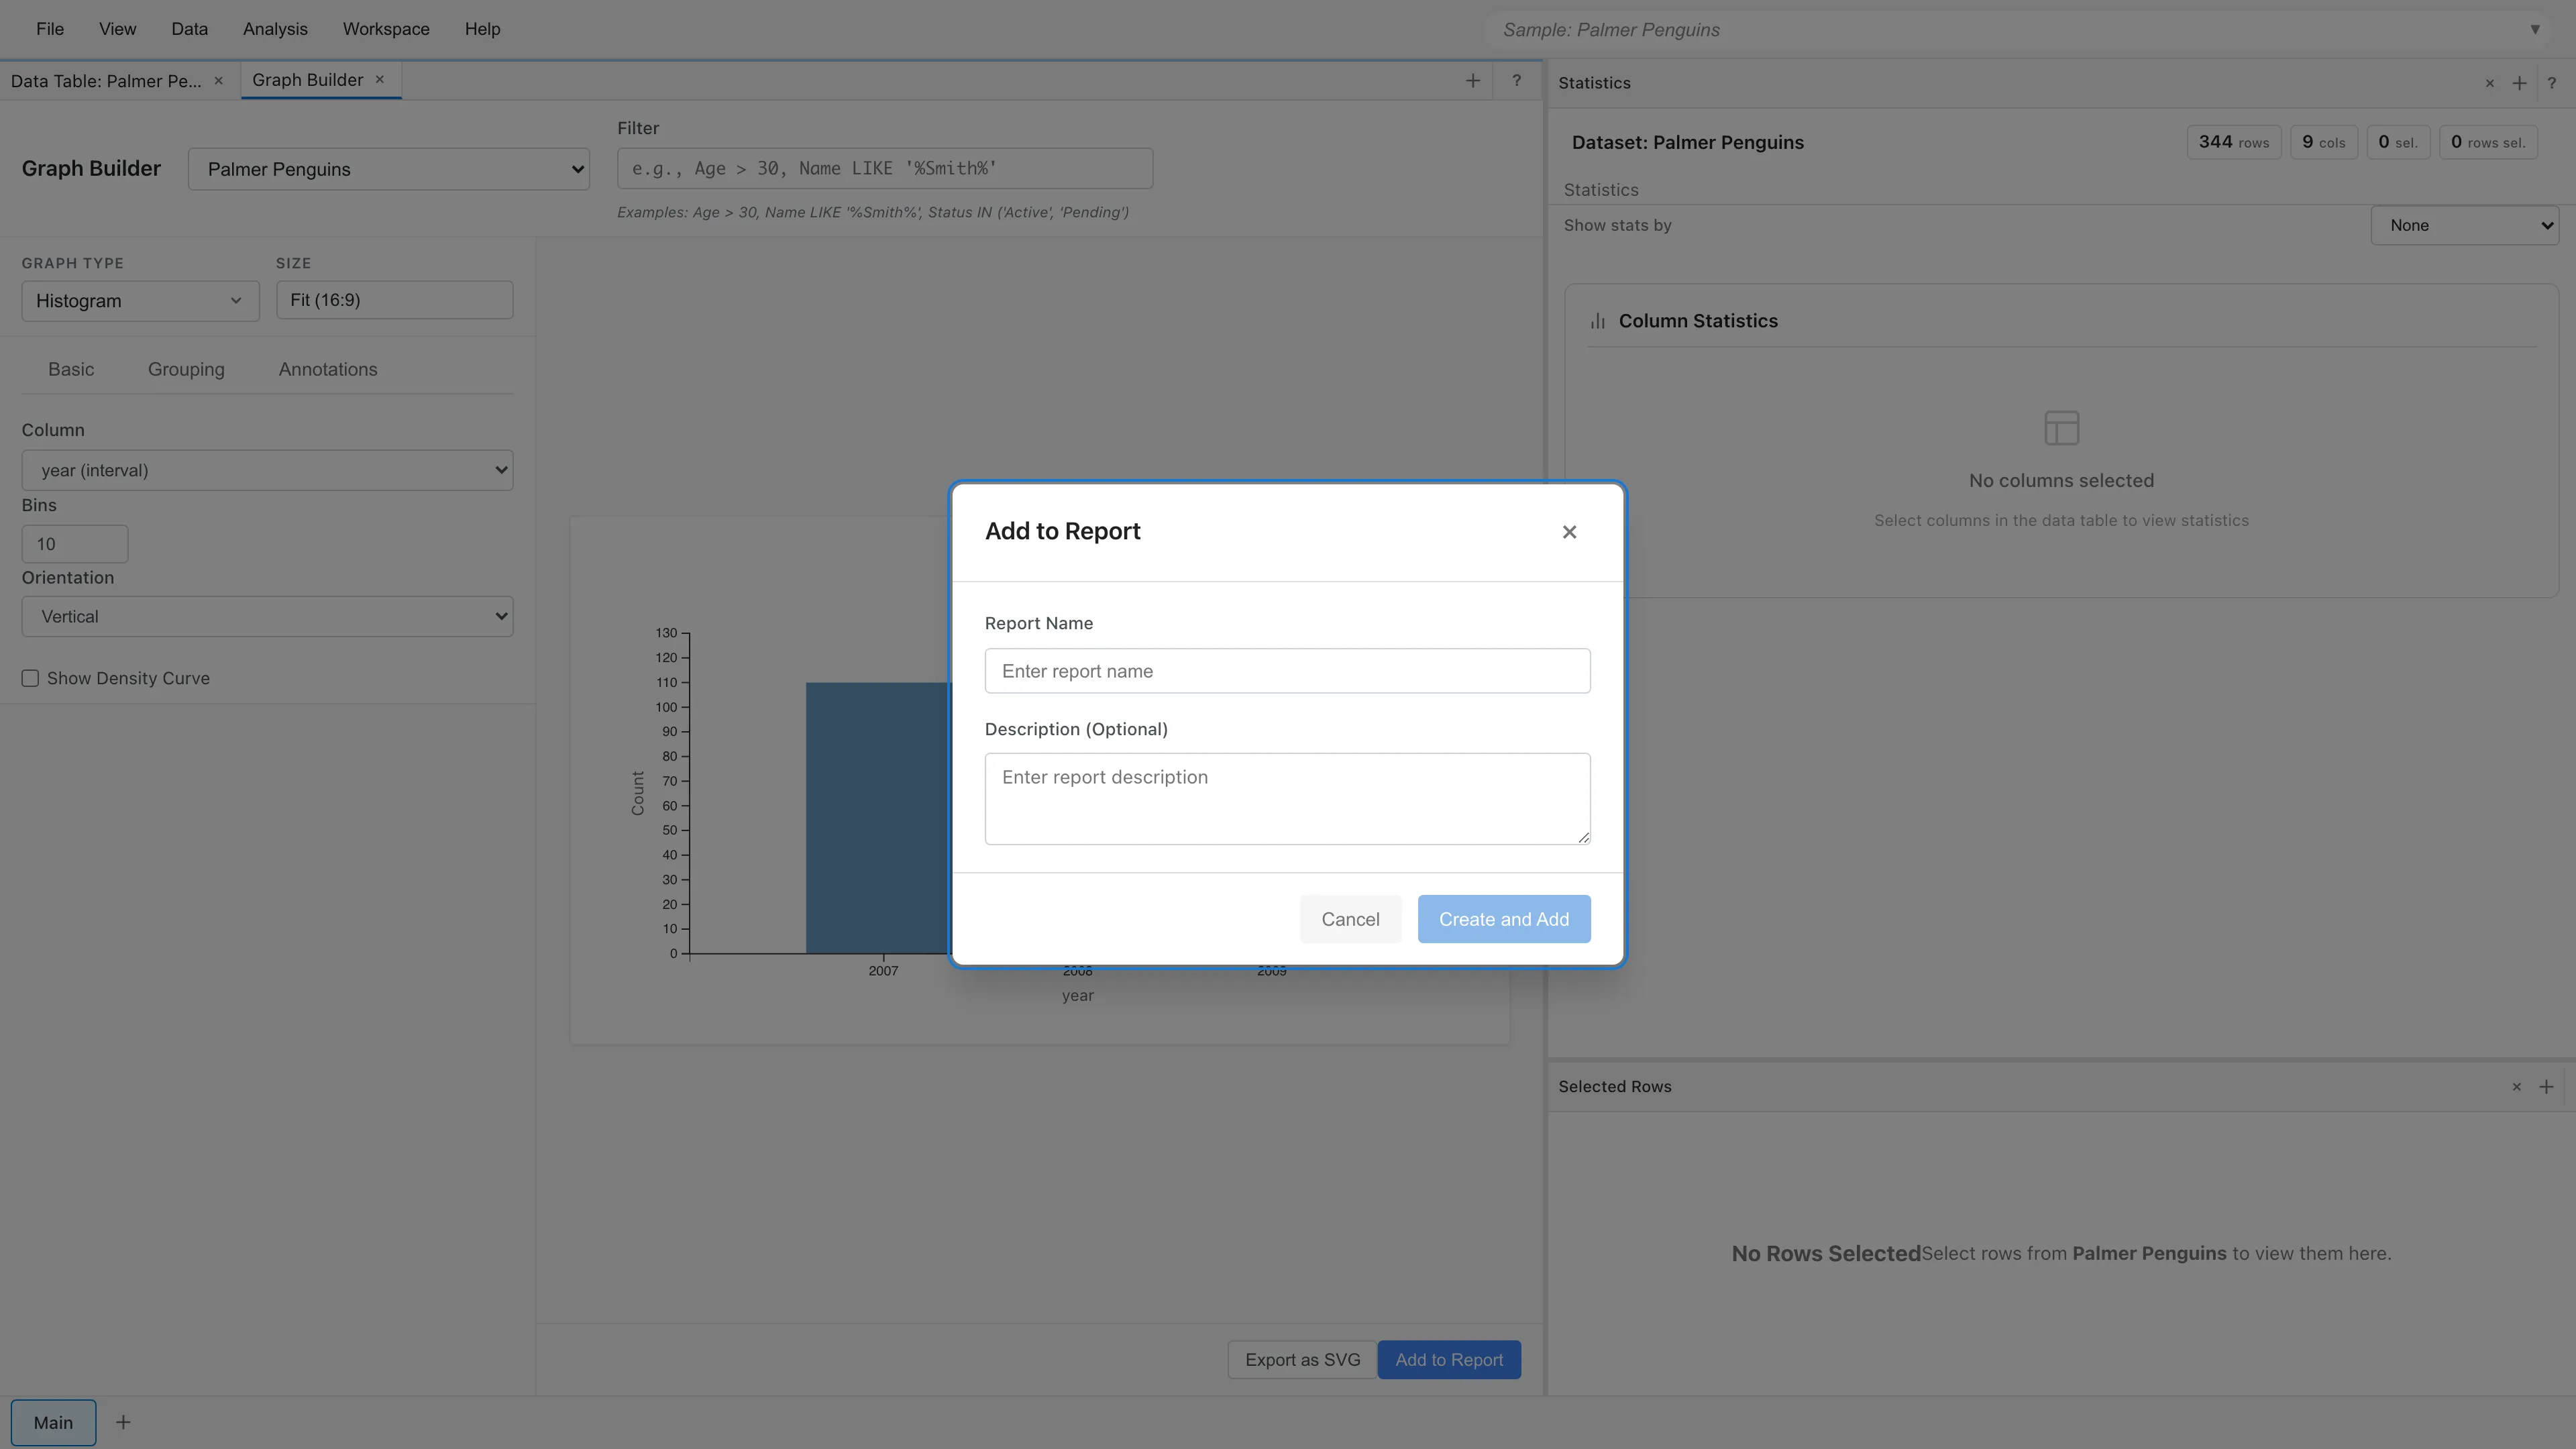
In the dialog, select an existing report or create a new one to add to. Added elements reference the original dataset. When the dataset content changes, such as by editing cells or adding and removing columns, the display in the report updates automatically. No manual refresh is needed.
When adding a Data Table, the dialog lets you choose which columns to display and the maximum number of rows (Maximum Rows to Display). The default is 100 rows; rows beyond the limit are not shown in the report.
Editing Reports
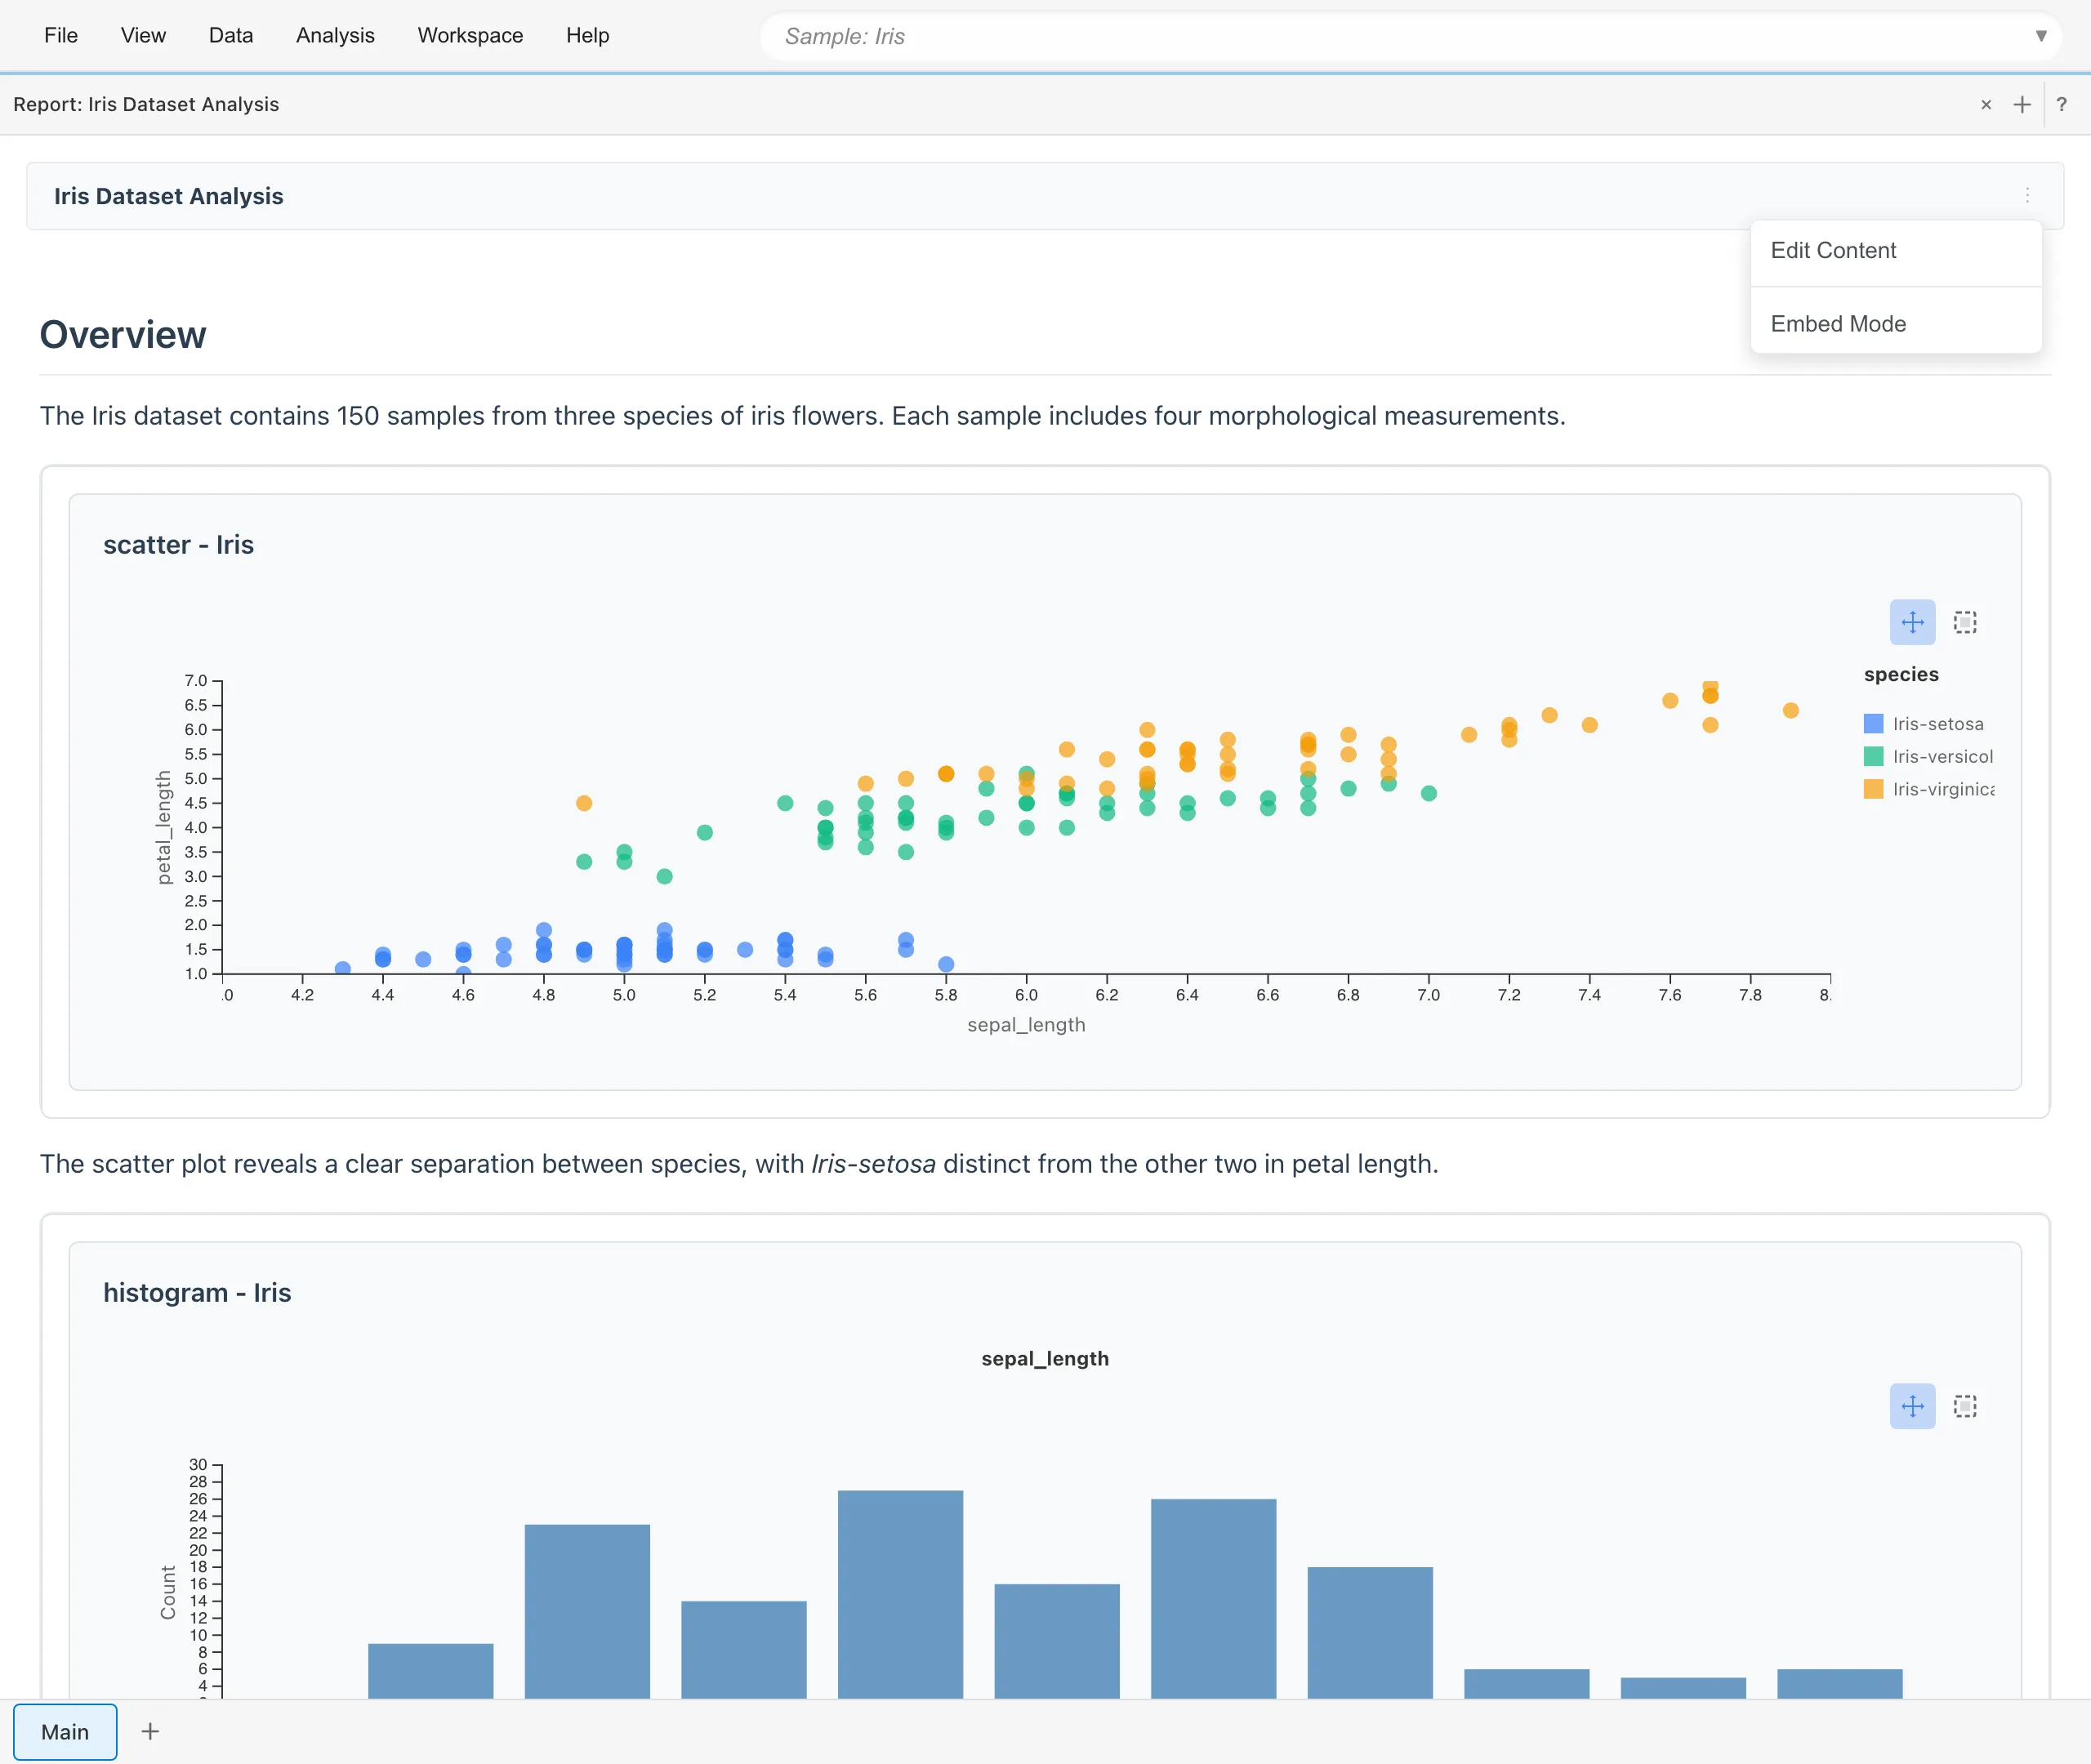
Select Edit Content from the ⋮ menu in the report header to open the editor.
Report Header Menu
- Edit Content - Open the Markdown editor to edit the report
- Embed Mode - View the report in read-only mode
Markdown Editor
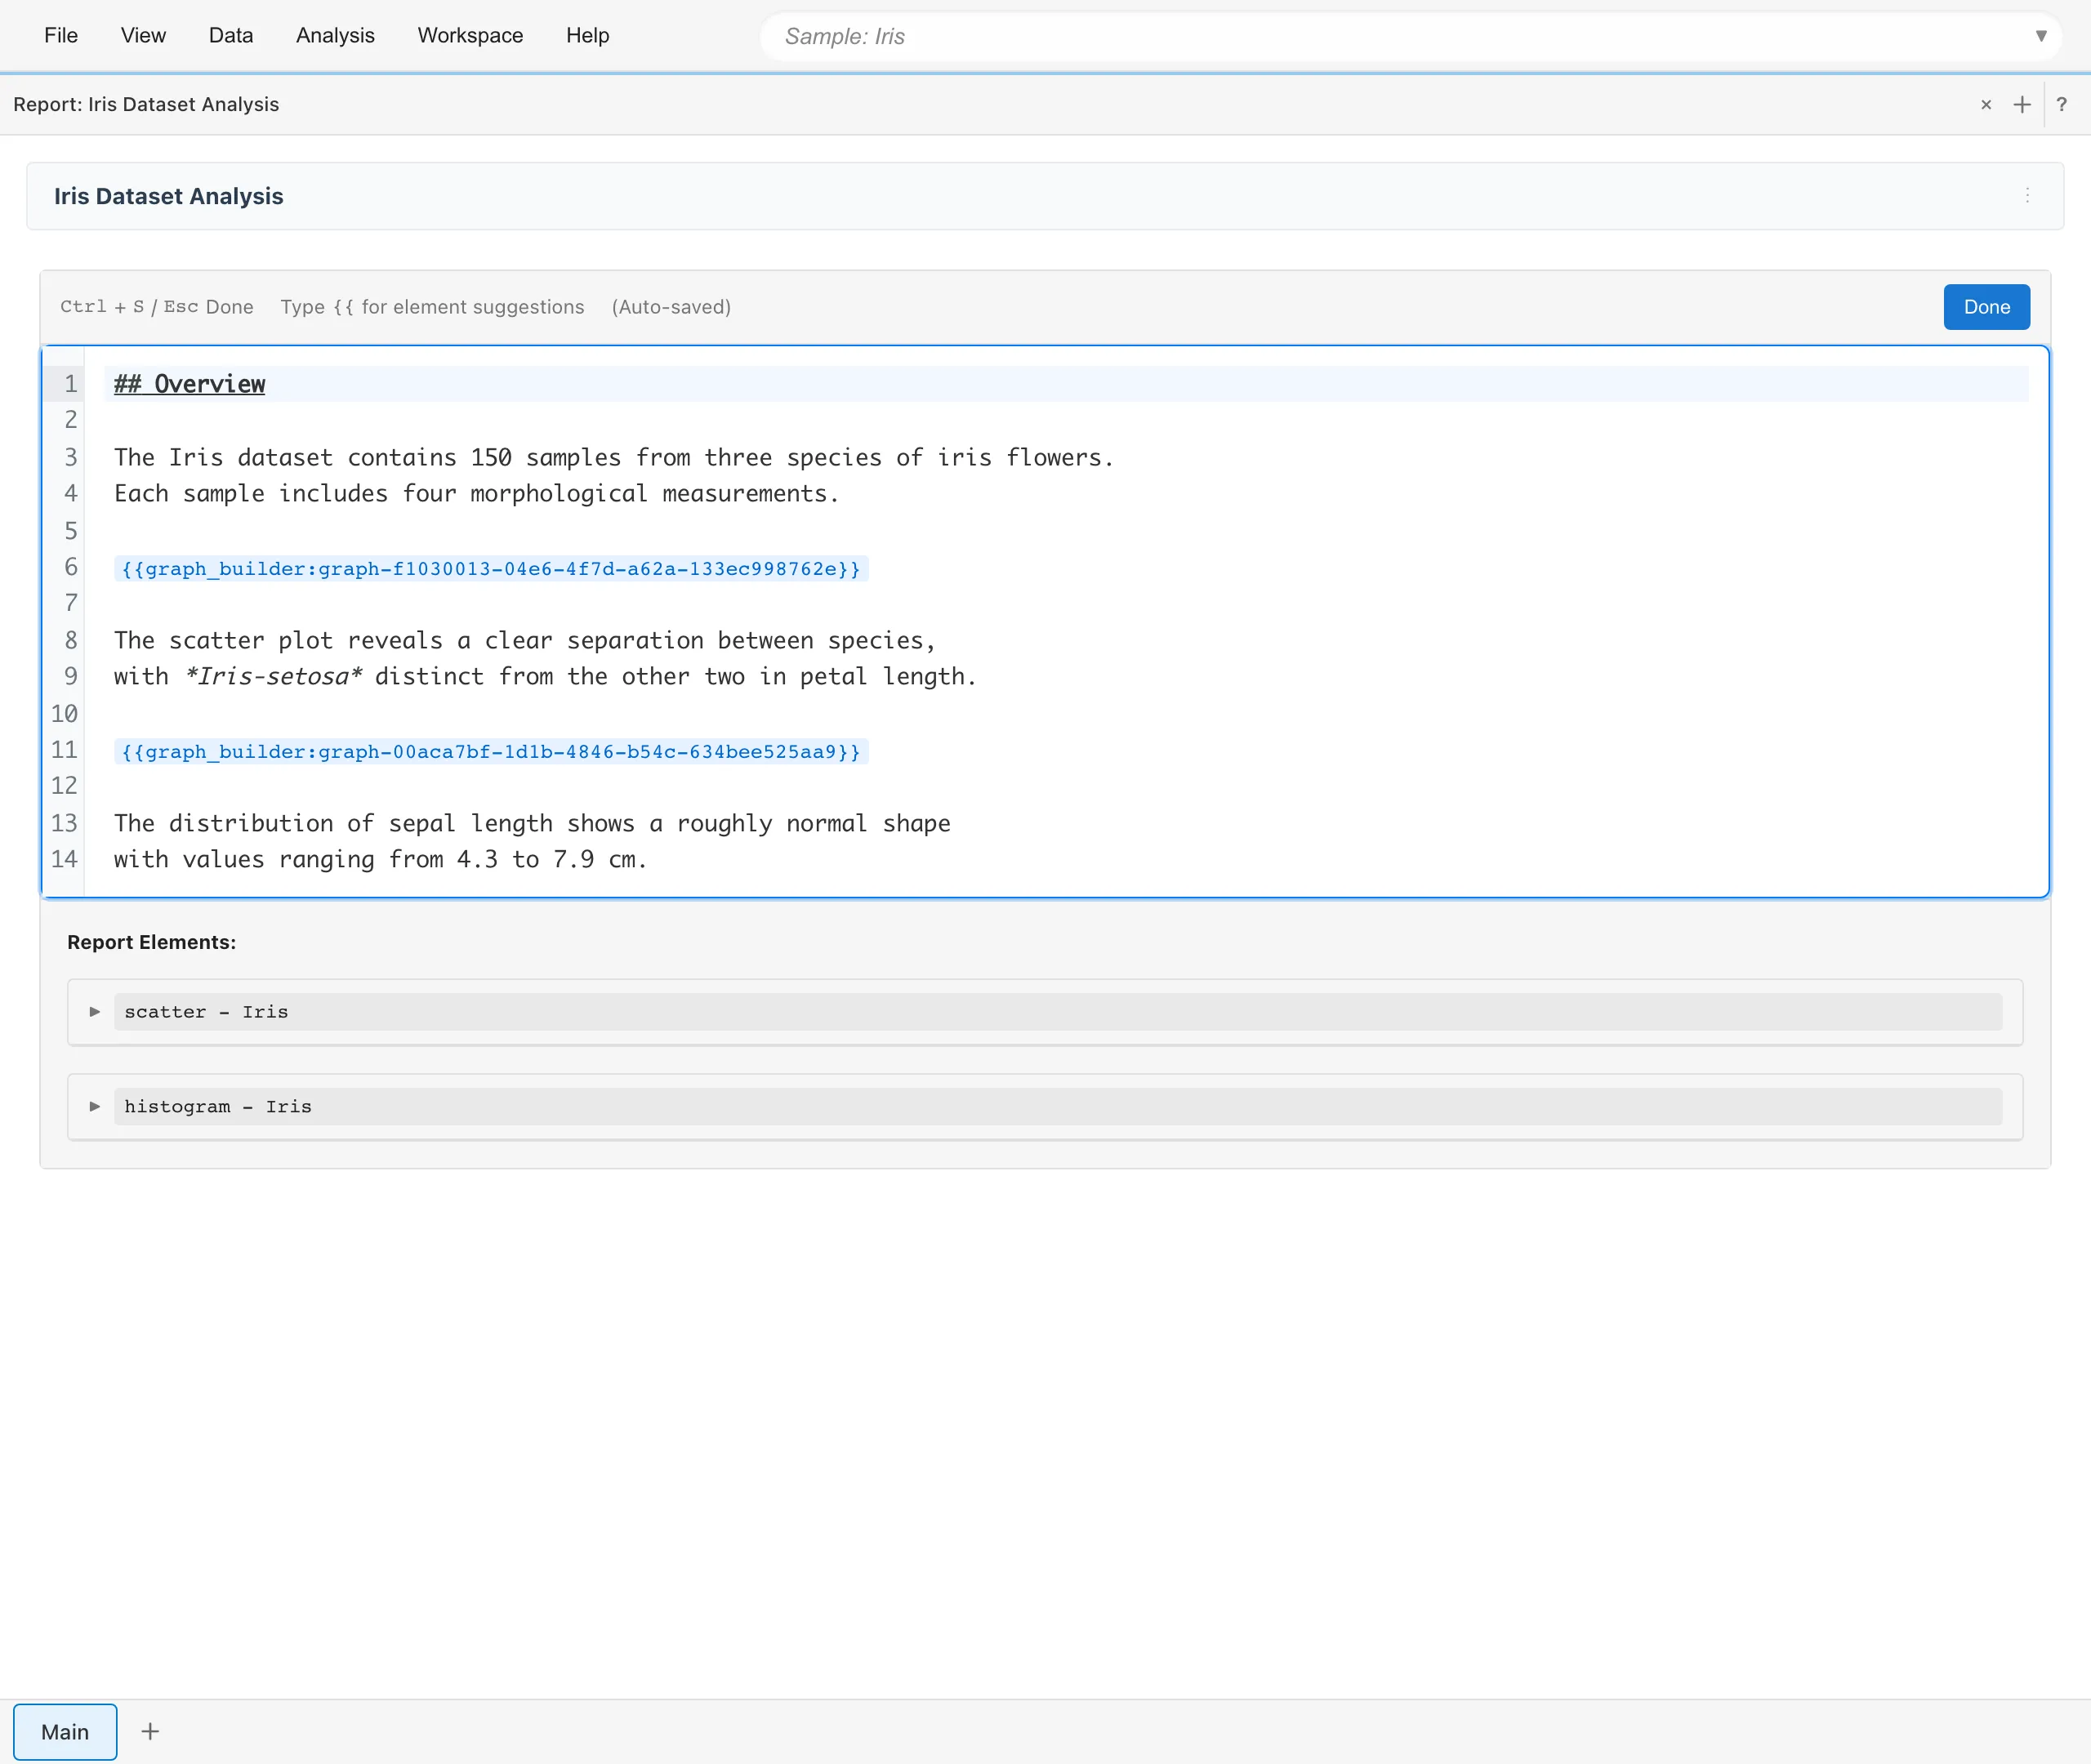
Reports use Markdown format. Embed elements using {{type:id}} syntax. Type {{ for autocomplete suggestions. To display {{ as literal text, write \{{. To display a literal \, write \\. LaTeX math notation is also supported ($...$ for inline, $$...$$ for block). Formulas are rendered with KaTeX. See KaTeX Supported Functions for the available commands.
Press Cmd/Ctrl+S or Esc to close the editor. Changes are auto-saved as you type.
Element Menu
When you open Edit Content, each element appears in the Report Elements list below the editor. Click an element name to copy its reference string to the clipboard for embedding in the text. Each element has a menu (...) with the following options:
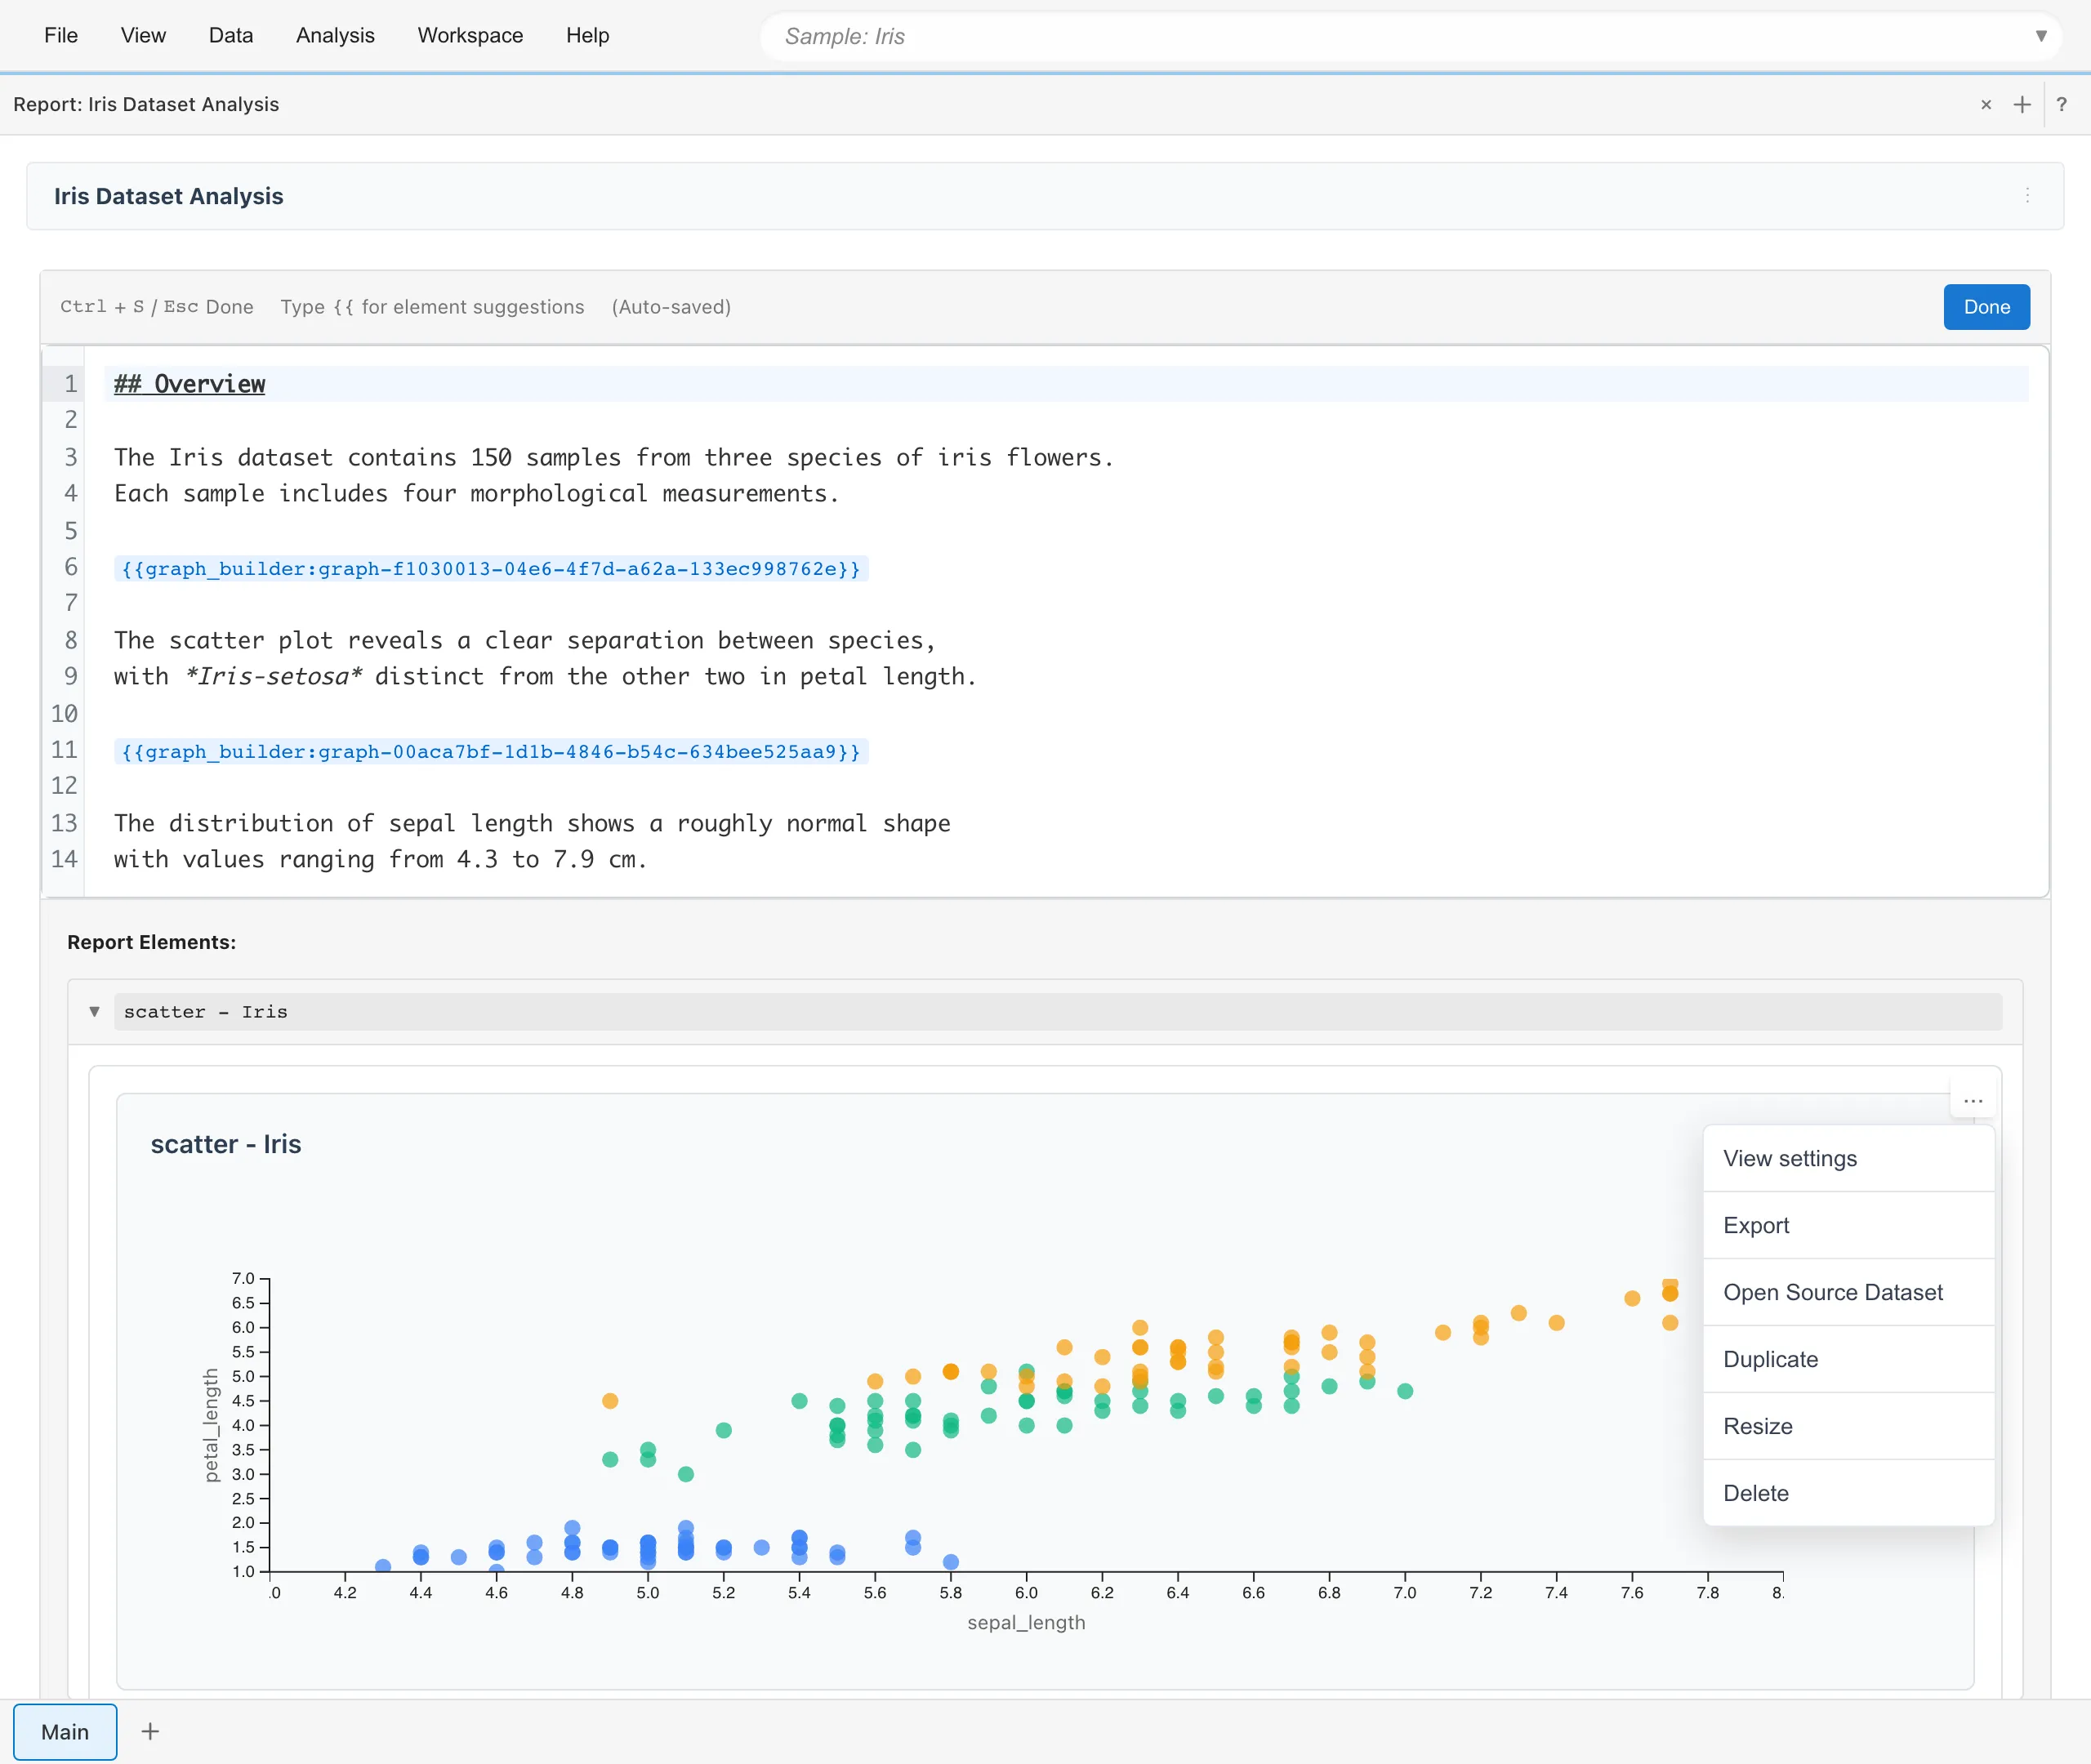
- View settings - View and edit element settings
- Export - Download as SVG (graphs only)
- Open Source Dataset - Open the source dataset
- Duplicate - Create a copy
- Resize - Adjust size and aspect ratio
- Delete - Remove from report
Export
Graphs can be exported as SVG from the element menu. See Export for details. Statistical tables and data tables cannot be exported individually. If you need the underlying data of a table, use Open Source Dataset in the element menu to open the source dataset and export it as CSV. Direct export to Word or PDF is not available. To create a PDF, switch to Embed Mode and use the browser's print function to save as PDF.
Embed Mode
Select Embed Mode from the ⋮ menu in the report header to view the report in read-only mode. The tab bar and menus are hidden, showing only the report content. Embed Mode only switches the view within the same browser; the report is not published externally, and no data is sent anywhere. Use this view for printing or taking screenshots. To return to the normal view, use the browser's back button.
See also
- Creating Graphs - Create graphs to add to reports
- Basic Statistics - View statistics to add to reports
Also available as a Markdown file.