Two-Sample Test / Paired Test
MIDAS provides two tabs for comparing two groups or two measurements:
- Two-Sample Test: Compare two independent groups using an independent t-test or a Mann-Whitney U test
- Paired Test: Compare two measurements from the same subjects using a paired t-test or a Wilcoxon signed-rank test
Basic Usage
Open a Tab
Select Analysis > Two-Sample Test... or Analysis > Paired Test... from the menu bar.
Run a Test
Configure the following in the settings panel on the left:
- Select a dataset from Dataset
- Choose a test method from Test Method
- Select variables
- Adjust options as needed
- Click Run Test
Two-Sample Test Tab
Compare population characteristics between two independent groups. Select one of the following from the Test Method dropdown.
Independent t-test (Welch's t-test)
Compare population means between two independent groups.
- Null hypothesis : (the two population means are equal)
- Alternative hypothesis : (for two-sided tests)
MIDAS uses Welch's t-test, which does not assume equal variances (why Welch's over Student's). Degrees of freedom are computed using the Welch-Satterthwaite approximation, which may yield non-integer values.
Variable Selection
Group Variable: Select a categorical variable (measurement scale is nominal or ordinal) that identifies the two groups. The variable must have exactly two unique values. An error is shown for three or more groups. One-way ANOVA is not currently available.
Outcome Variable: Select the numeric variable (measurement scale is interval or ratio) whose means you want to compare.
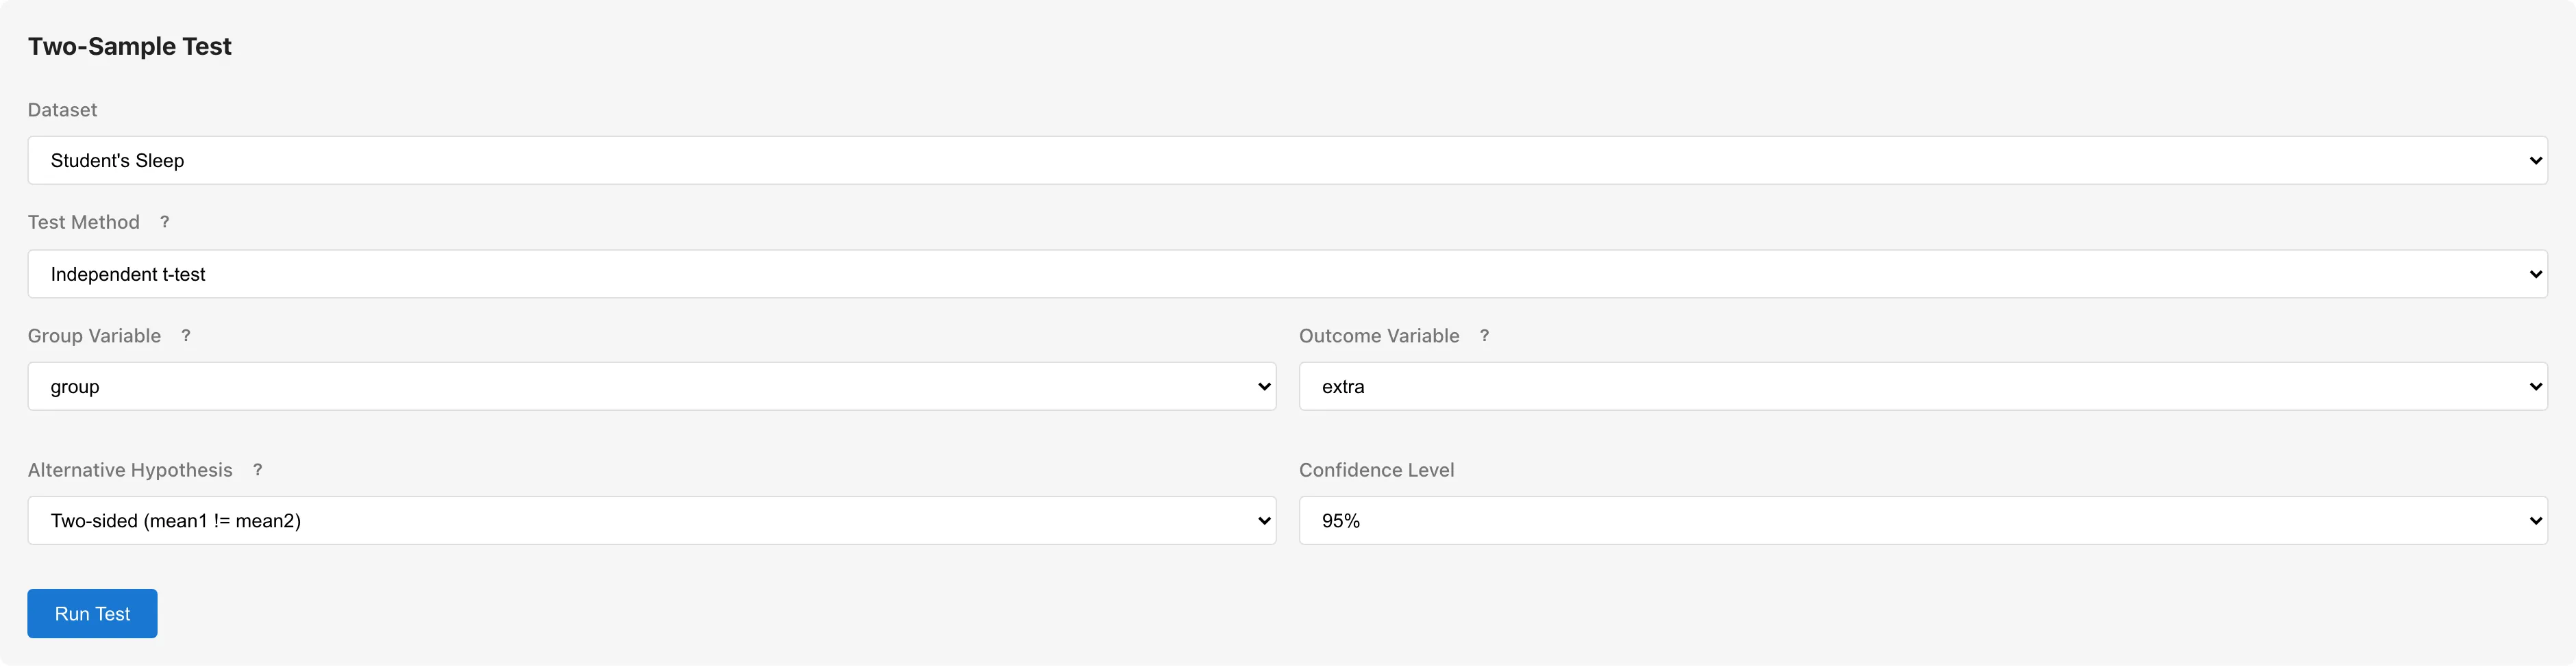
Example
To test whether the extra hours of sleep differ between two soporific drugs in the Student's Sleep sample data:
- Dataset: Student's Sleep
- Test Method: Independent t-test
- Group Variable:
group - Outcome Variable:
extra - Click Run Test
Mann-Whitney U Test
Compare whether the distributions of two independent groups differ. This is a rank-based nonparametric test that does not assume normality.
- Null hypothesis : The two samples come from the same distribution
- Alternative hypothesis : The two distributions differ (for two-sided tests)
The test ranks all observations from both groups together and compares the rank sums. See Hypothesis Testing Fundamentals for the statistical background.
Variable Selection
Same as the independent t-test: select a Group Variable with exactly two values and a numeric Outcome Variable.
Results
| Statistic | Description |
|---|---|
| U | The Mann-Whitney U statistic. The smaller of and , where is derived from the rank sum of group |
| z | Normal approximation of the U statistic, with tie correction and continuity correction applied |
| p-value | Computed from the normal approximation. Reject if less than the significance level |
| Rank-biserial r | Effect size based on the difference in mean ranks between groups, ranging from to . See Hypothesis Testing Fundamentals for interpretation |
Paired t-test
See the Paired Test tab section below.
Paired Test Tab
Compare two measurements taken from the same subjects. Use this for pre- and post-treatment comparisons, or different characteristics measured on the same sample. Select one of the following from the Test Method dropdown.
Paired t-test
Test the mean difference between two measurements taken from the same subjects.
- Null hypothesis : (the mean of differences is zero)
- Alternative hypothesis : (for two-sided tests)
Internally, the test computes pairwise differences and performs a one-sample t-test on .
Variable Selection
Select two numeric variables to compare as Variable 1 and Variable 2.
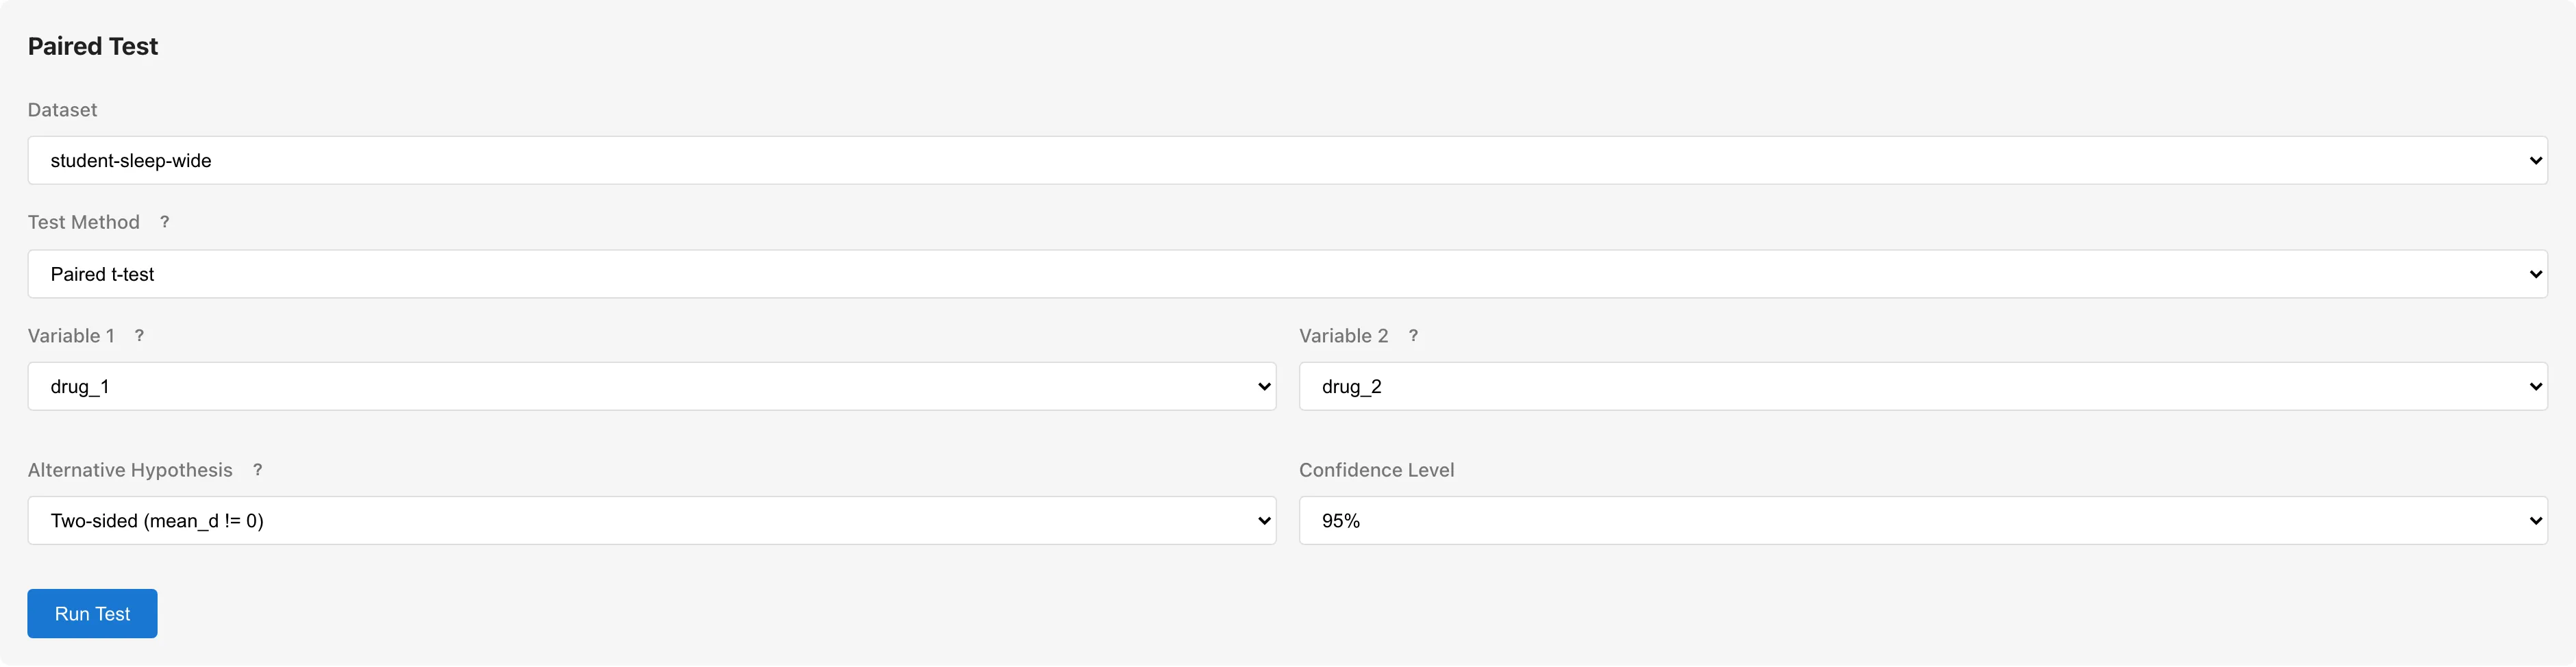
Example
To compare the effects of two soporific drugs on the same subjects using the same Student's Sleep sample data. Since each subject received both drugs, a paired t-test is appropriate.
The paired t-test requires Variable 1 and Variable 2 as separate columns. The Student's Sleep sample data is in long format, so use Reshape to convert to wide format, or load the wide-format CSV.
- Dataset: Student's Sleep (wide format)
- Test Method: Paired t-test
- Variable 1:
drug_1 - Variable 2:
drug_2 - Click Run Test
Wilcoxon Signed-Rank Test
Test whether the distribution of pairwise differences is symmetric about zero. This is a rank-based nonparametric test that does not assume normality of the differences.
- Null hypothesis : The distribution of differences is symmetric about zero
- Alternative hypothesis : The distribution of differences is not symmetric about zero (for two-sided tests)
The test computes pairwise differences, discards zero differences, ranks the absolute differences, and compares the sum of positive ranks () to the sum of negative ranks (). See Hypothesis Testing Fundamentals for the statistical background.
Variable Selection
Same as the paired t-test: select two numeric variables as Variable 1 and Variable 2.
Results
| Statistic | Description |
|---|---|
| W+ | Sum of ranks for positive differences |
| W- | Sum of ranks for negative differences |
| z | Normal approximation of the W statistic, with tie correction and continuity correction applied |
| p-value | Computed from the normal approximation. Reject if less than the significance level |
| Rank-biserial r | Effect size based on the difference between and , ranging from to . See Hypothesis Testing Fundamentals for interpretation |
Options
The following options are shared by all test methods.
Alternative Hypothesis
For independent tests (t-test and Mann-Whitney U), and represent the population parameters of the two groups. For paired tests (paired t-test and Wilcoxon signed-rank), represents the population parameter of the differences.
| Option | Two-Sample Tests | Paired Tests | Description |
|---|---|---|---|
| Two-sided | Test for a difference in either direction. Default | ||
| Less | One-sided. Assumes Variable 1 is smaller | ||
| Greater | One-sided. Assumes Variable 1 is larger |
One-sided tests have greater power but cannot detect differences in the opposite direction. Use only when you have a prior directional hypothesis.
Confidence Level
Determines the width of the confidence interval for the mean difference. Choose from 90%, 95% (default), or 99%. Applies to t-tests only; nonparametric tests do not produce confidence intervals.
Reading the Results
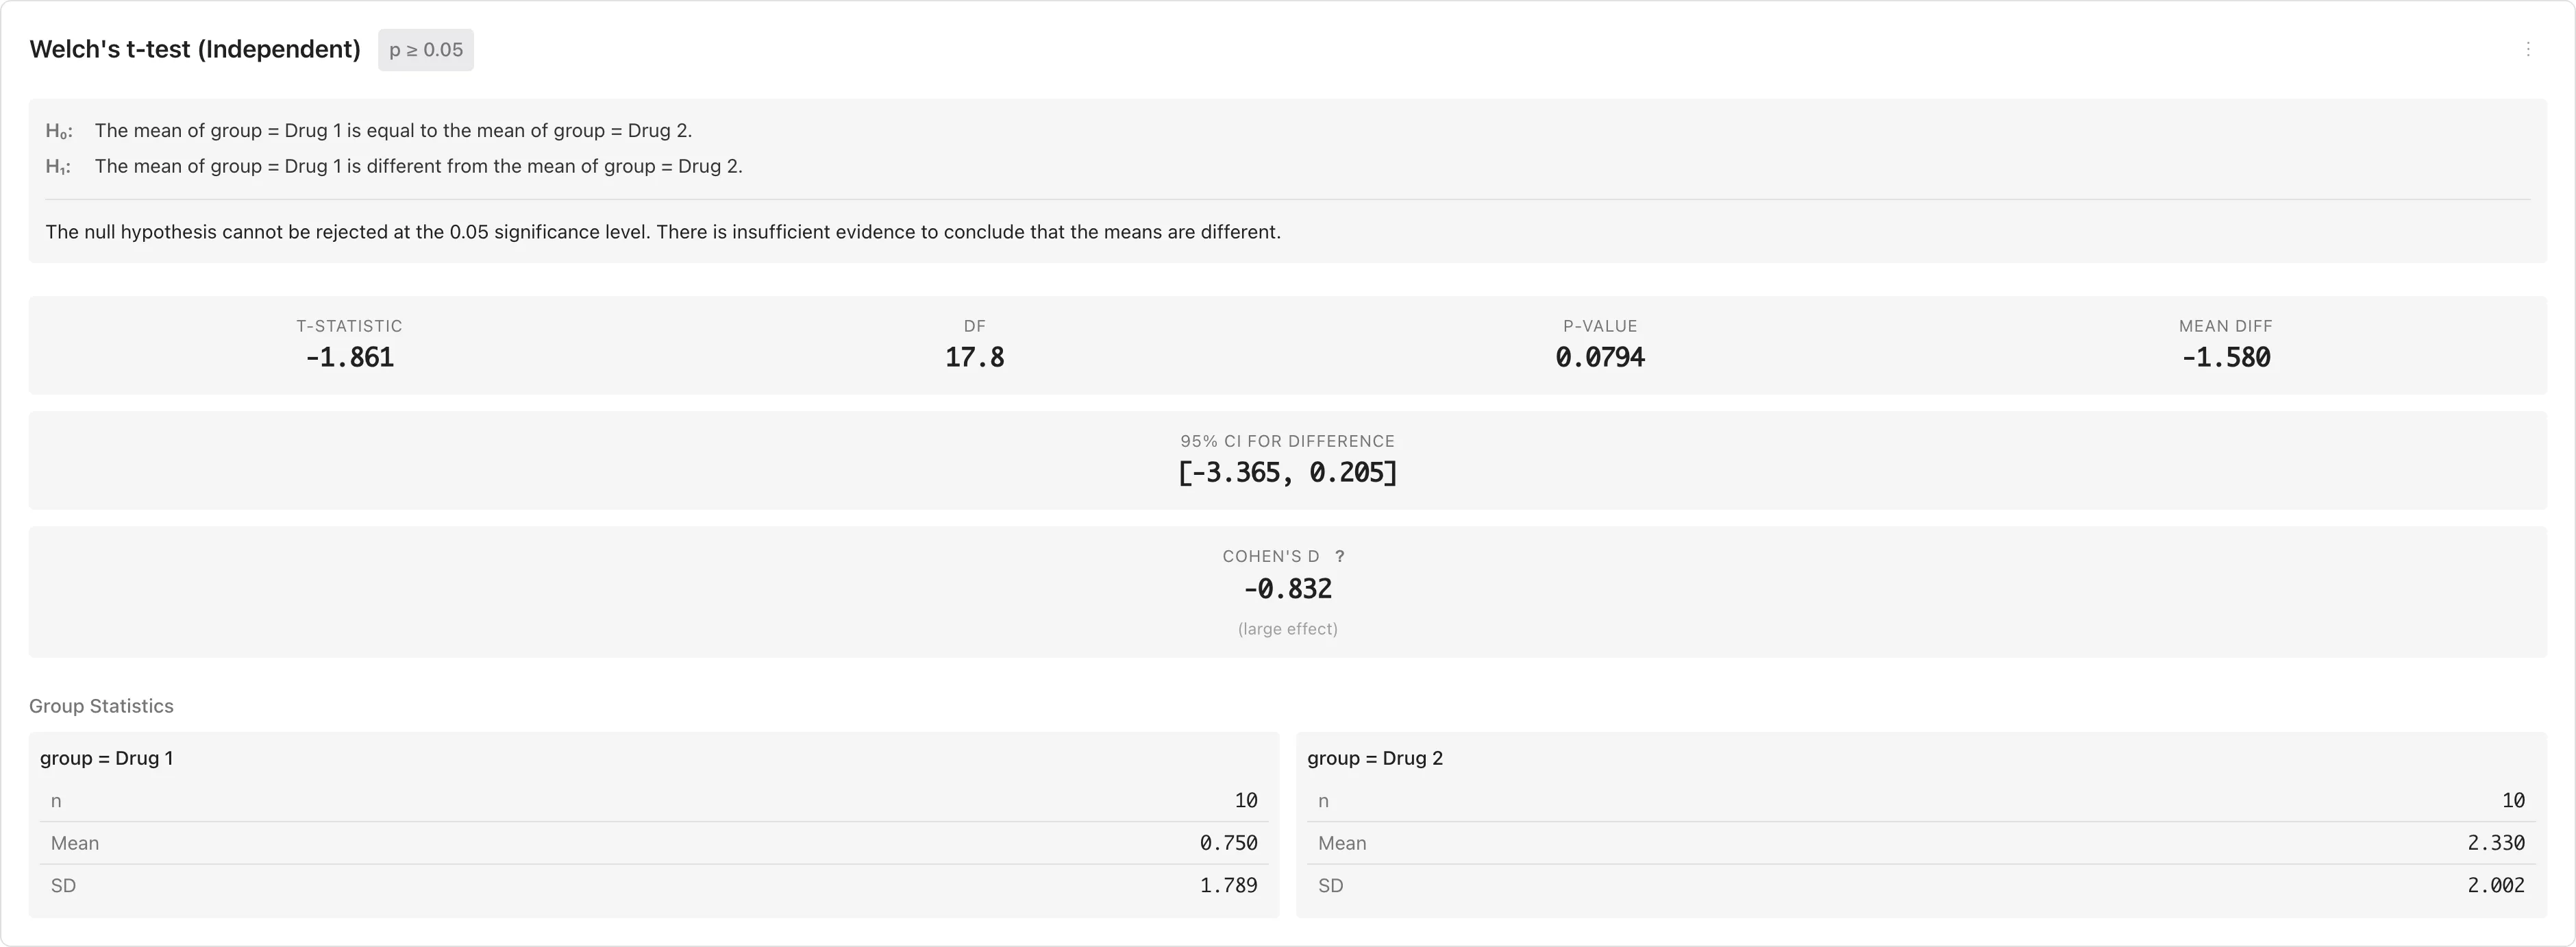
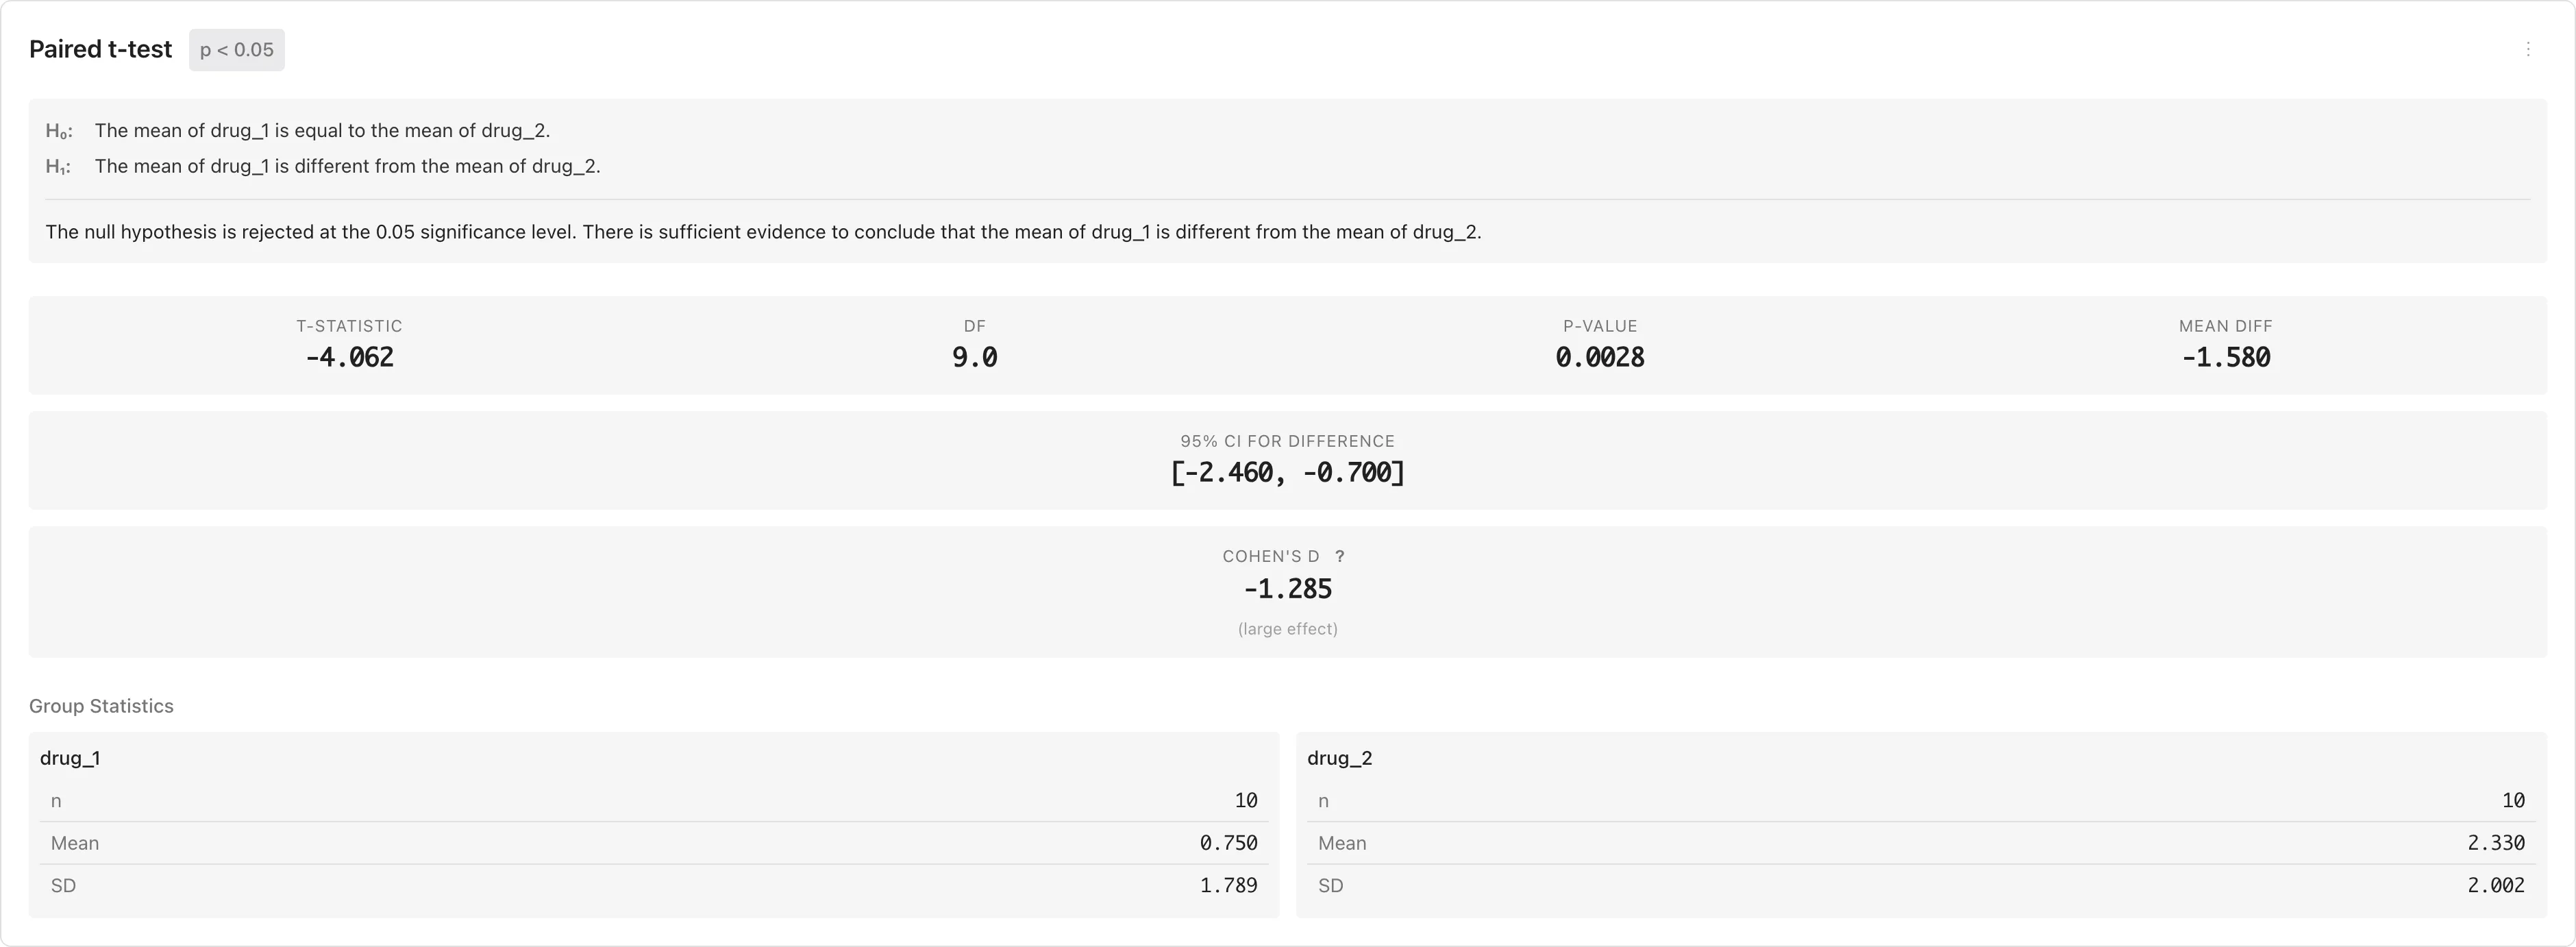
t-test Results
The results panel displays and at the top, followed by a conclusion statement. Below that, main statistics (t statistic, degrees of freedom, p-value, mean difference), confidence interval, Cohen's d, and group statistics are shown in cards.
| Statistic | Description |
|---|---|
| t-statistic | The t test statistic |
| df | Degrees of freedom. For independent t-tests, may be non-integer due to the Welch-Satterthwaite approximation. For paired t-tests, |
| p-value | Reject if less than the significance level |
| Mean diff | Mean difference. for independent t-tests, for paired t-tests |
| 95% CI | Confidence interval for the mean difference. If it does not contain zero, can be rejected (for two-sided tests) |
| Cohen's d | Mean difference divided by a standard deviation -- pooled SD for independent t-tests, SD of differences for paired t-tests. See Hypothesis Testing Fundamentals for details |
Click the menu button (...) in the results header and select Copy APA format to copy the results in APA style to the clipboard.
Independent t-test Results
Paired t-test Results
Nonparametric Test Results
The results panel displays and at the top, followed by a conclusion statement. Below that, the test statistic (U or W+/W-), z-score, p-value, and rank-biserial r are shown.
| Statistic | Description |
|---|---|
| U (Mann-Whitney) | The U statistic derived from rank sums |
| W+ / W- (Wilcoxon) | Sum of positive and negative ranks of the differences |
| z | Normal approximation with tie correction and continuity correction |
| p-value | Reject if less than the significance level |
| Rank-biserial r | Effect size ranging from to . Values near indicate strong separation between groups (Mann-Whitney) or strong asymmetry in differences (Wilcoxon). See Hypothesis Testing Fundamentals for details |
Diagnostics
After running a test, a diagnostics panel appears below the results. See Hypothesis Testing Fundamentals for the normality assumption and diagnostic approach.
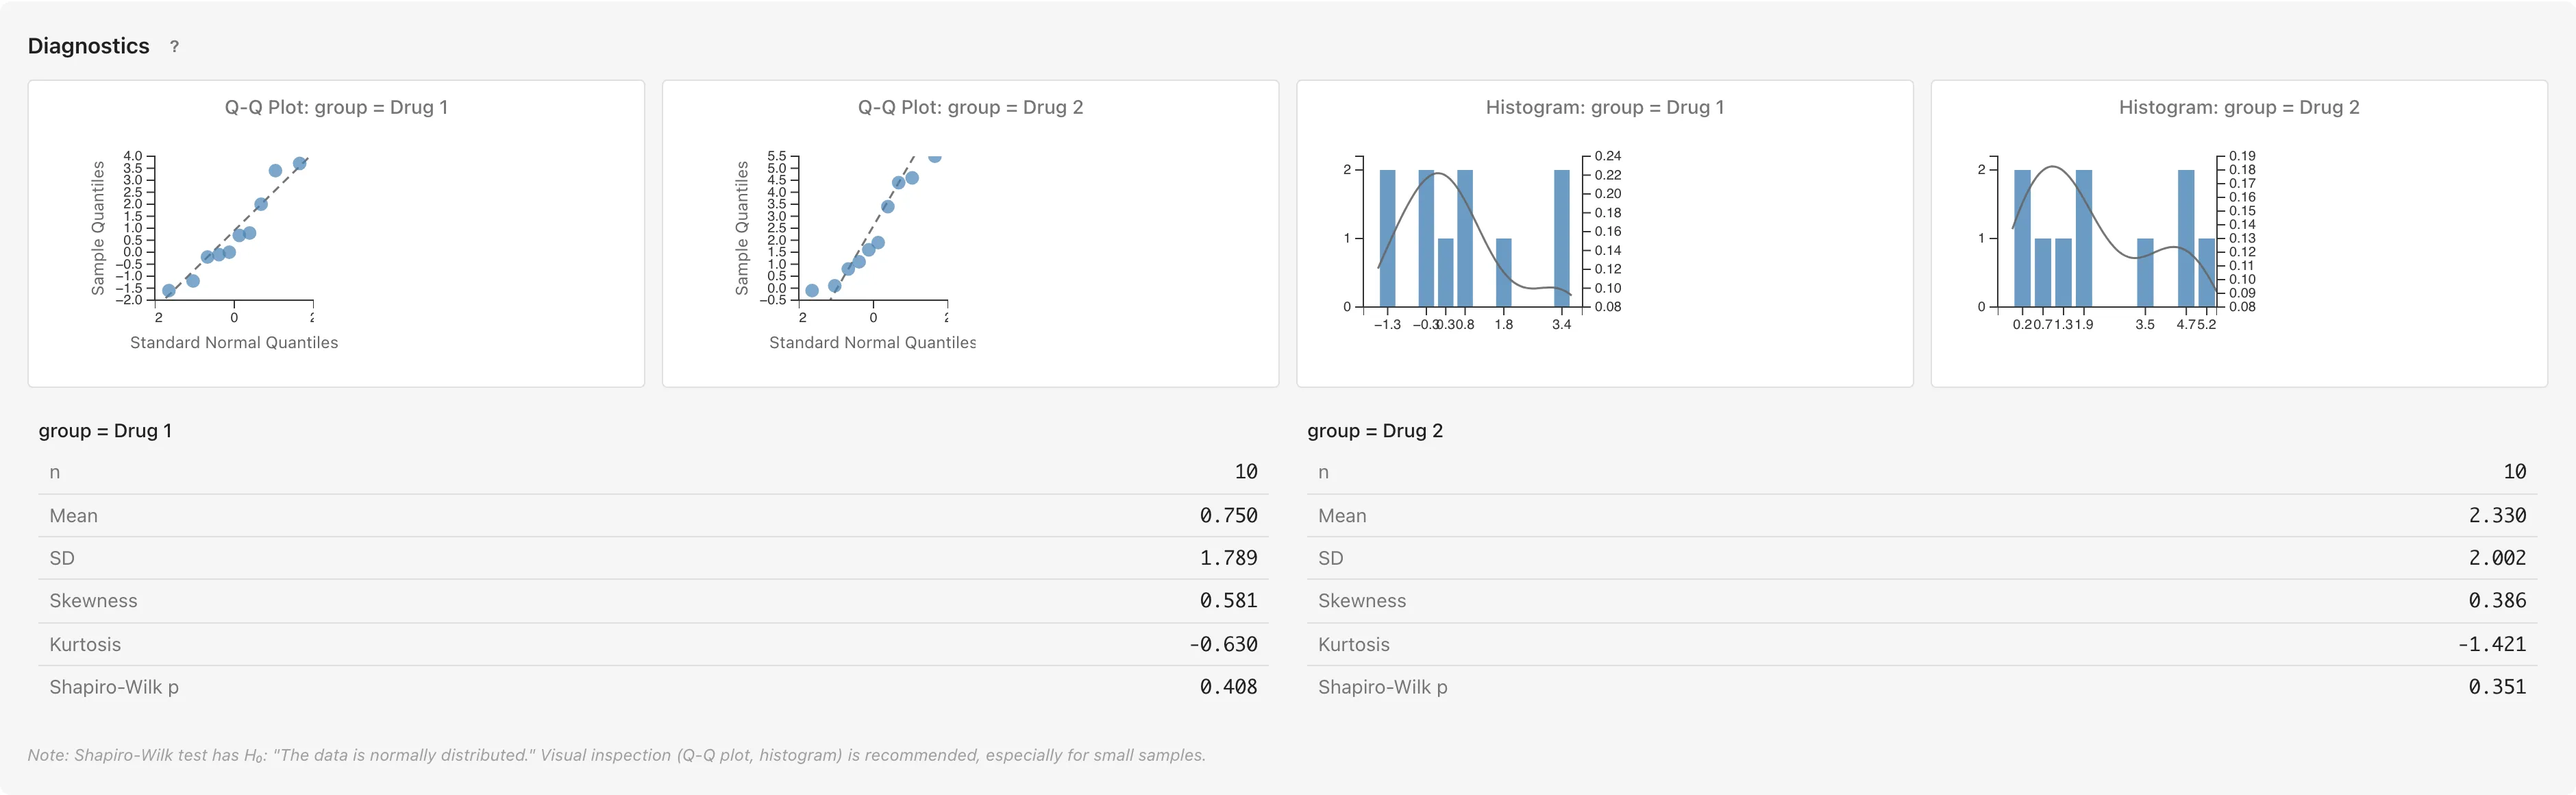
The diagnostics panel includes Q-Q plots, histograms, descriptive statistics (n, Mean, SD, Skewness, Kurtosis), and the Shapiro-Wilk normality test. In Q-Q plots, points falling near the diagonal line suggest approximate normality, while systematic deviation in the tails suggests skewness or heavy tails. Histograms show the shape of the data distribution. Skewness and Kurtosis are both zero for a normal distribution; the further these values deviate from zero, the greater the departure from normality. The Shapiro-Wilk test has : "the population is normally distributed," but with large samples even minor deviations reach significance, so combine with Q-Q plot assessment.
For nonparametric tests (Mann-Whitney U and Wilcoxon signed-rank), normality is not an assumption. The diagnostics panel still displays Q-Q plots, histograms, and descriptive statistics to help you understand the shape of your data distributions. This information is useful for characterizing the data regardless of the test method.
Two-Sample Test Diagnostics
Q-Q plots, histograms, descriptive statistics, and Shapiro-Wilk tests are displayed for each group (each value of the Group Variable).
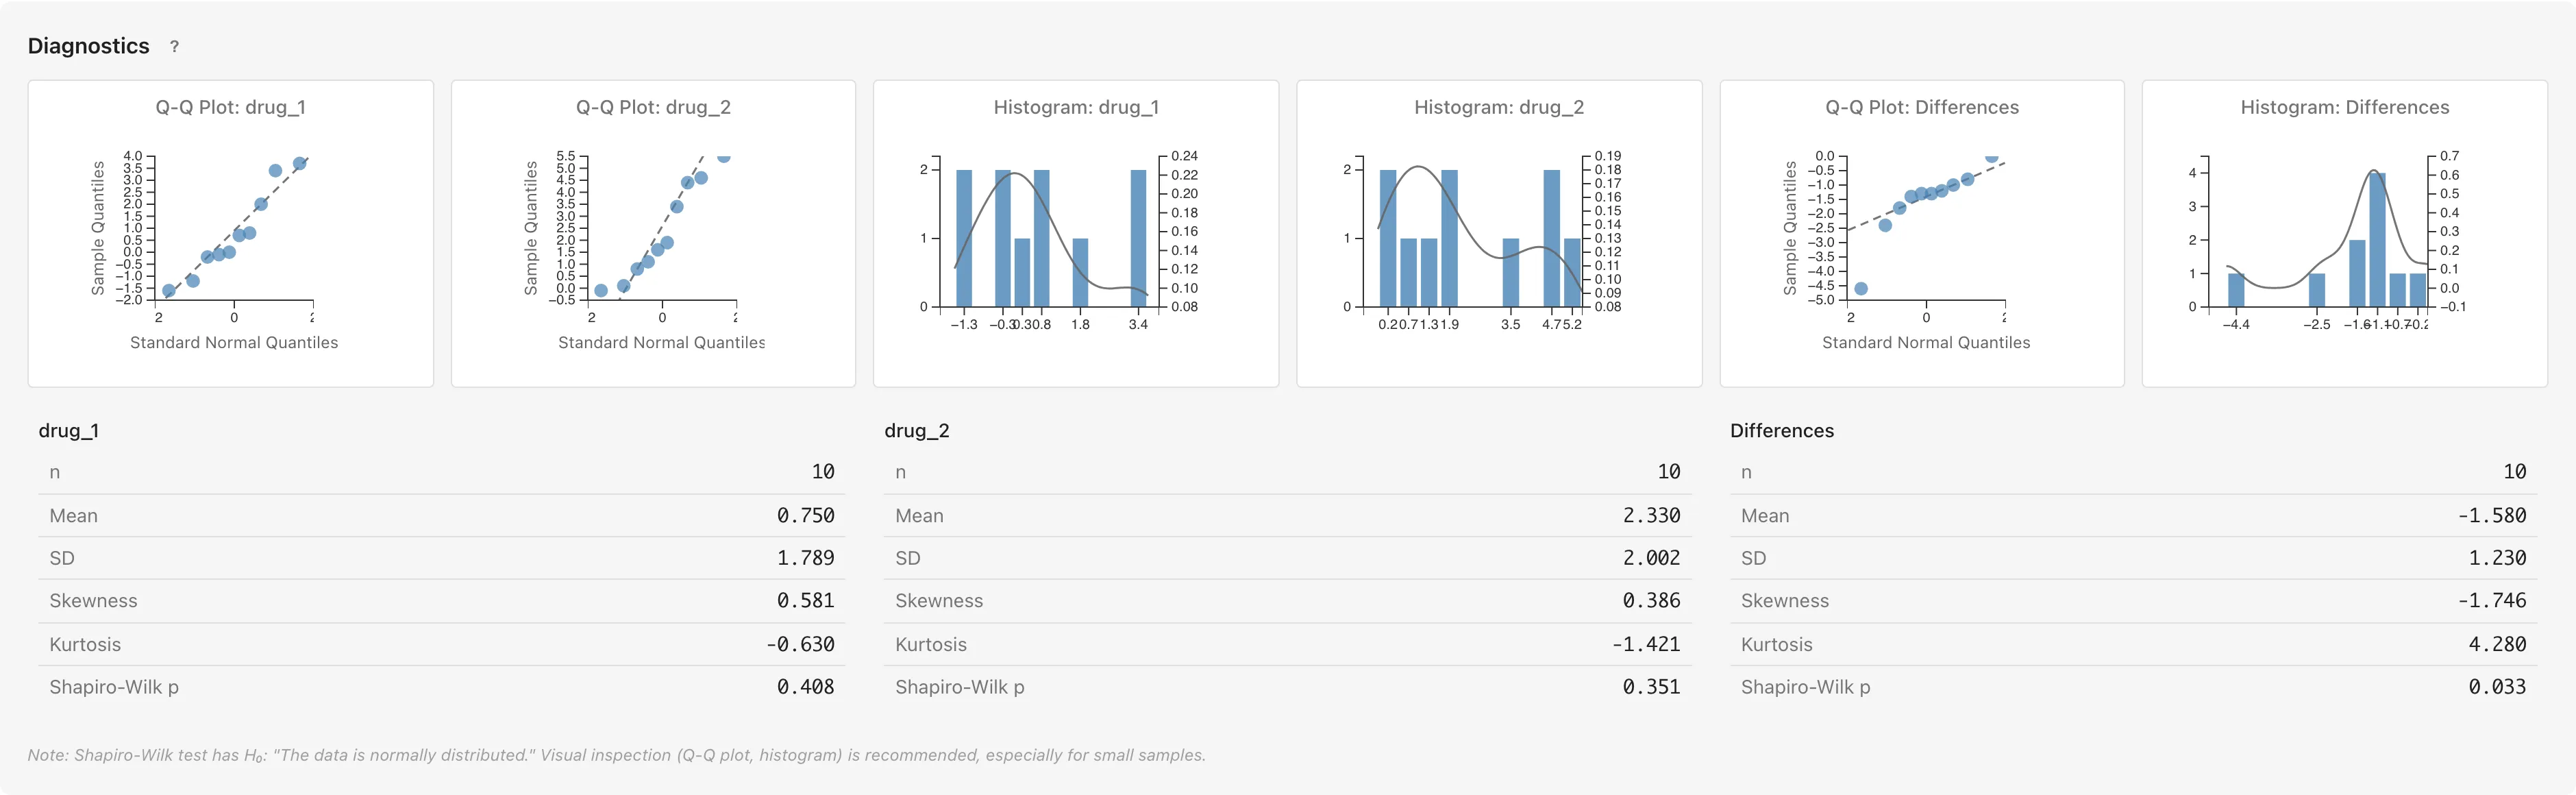
Paired Test Diagnostics
Diagnostics are displayed for each variable (Variable 1, Variable 2) as well as for the Differences (Variable 1 − Variable 2).
Since the paired t-test is internally a one-sample t-test on the differences , the normality of the differences -- not the individual variables -- directly determines the validity of the test (see Normality Assumption).
Row Selection
Select data rows from the diagnostic plots.
Select from Q-Q Plots
Click a point on the Q-Q plot to select the corresponding data row. Hold Ctrl (Mac: Cmd) while clicking to add to the existing selection.
Select from Histograms
Click a bar on the histogram to select all rows in that bin. Hold Ctrl (Mac: Cmd) while clicking to add to the existing selection.
Open Filtered Data Tab
Double-click a histogram bar to open a Filtered Data tab showing the selected data.
Missing Values
Rows containing missing values (NaN, Infinity) are automatically excluded from the analysis. The number of excluded rows is displayed in the results panel. For paired tests, pairs where either variable has a missing value are excluded.
Other Test Methods
Chi-square test of independence is available in Cross Tabulation. One-way ANOVA is not currently available.
References
- Welch, B. L. (1947). The generalization of "Student's" problem when several different population variances are involved. Biometrika, 34(1-2), 28-35.
- Cohen, J. (1988). Statistical Power Analysis for the Behavioral Sciences (2nd ed., pp. 25-27). Lawrence Erlbaum Associates.
- Shapiro, S. S., & Wilk, M. B. (1965). An analysis of variance test for normality (complete samples). Biometrika, 52(3-4), 591-611.
- Mann, H. B., & Whitney, D. R. (1947). On a test of whether one of two random variables is stochastically larger than the other. Annals of Mathematical Statistics, 18(1), 50-60.
- Wilcoxon, F. (1945). Individual comparisons by ranking methods. Biometrics Bulletin, 1(6), 80-83.