Reports
Compile your graphs and analysis results into a single document with Markdown formatting.
Creating a Report
There are two ways to create a report.
Create a New Report
Click the + button in the tab bar to open the Create New Tab dialog, then select Report. Click Untitled Report to create a new report.
Create from Add to Report
Right-click on a graph and select Create New Report from the menu to create a new report containing that graph.
Opening a Report
Click the + button in the tab bar to open the Create New Tab dialog, then select Report. Click on an existing report from the list to open it.
Adding to Reports
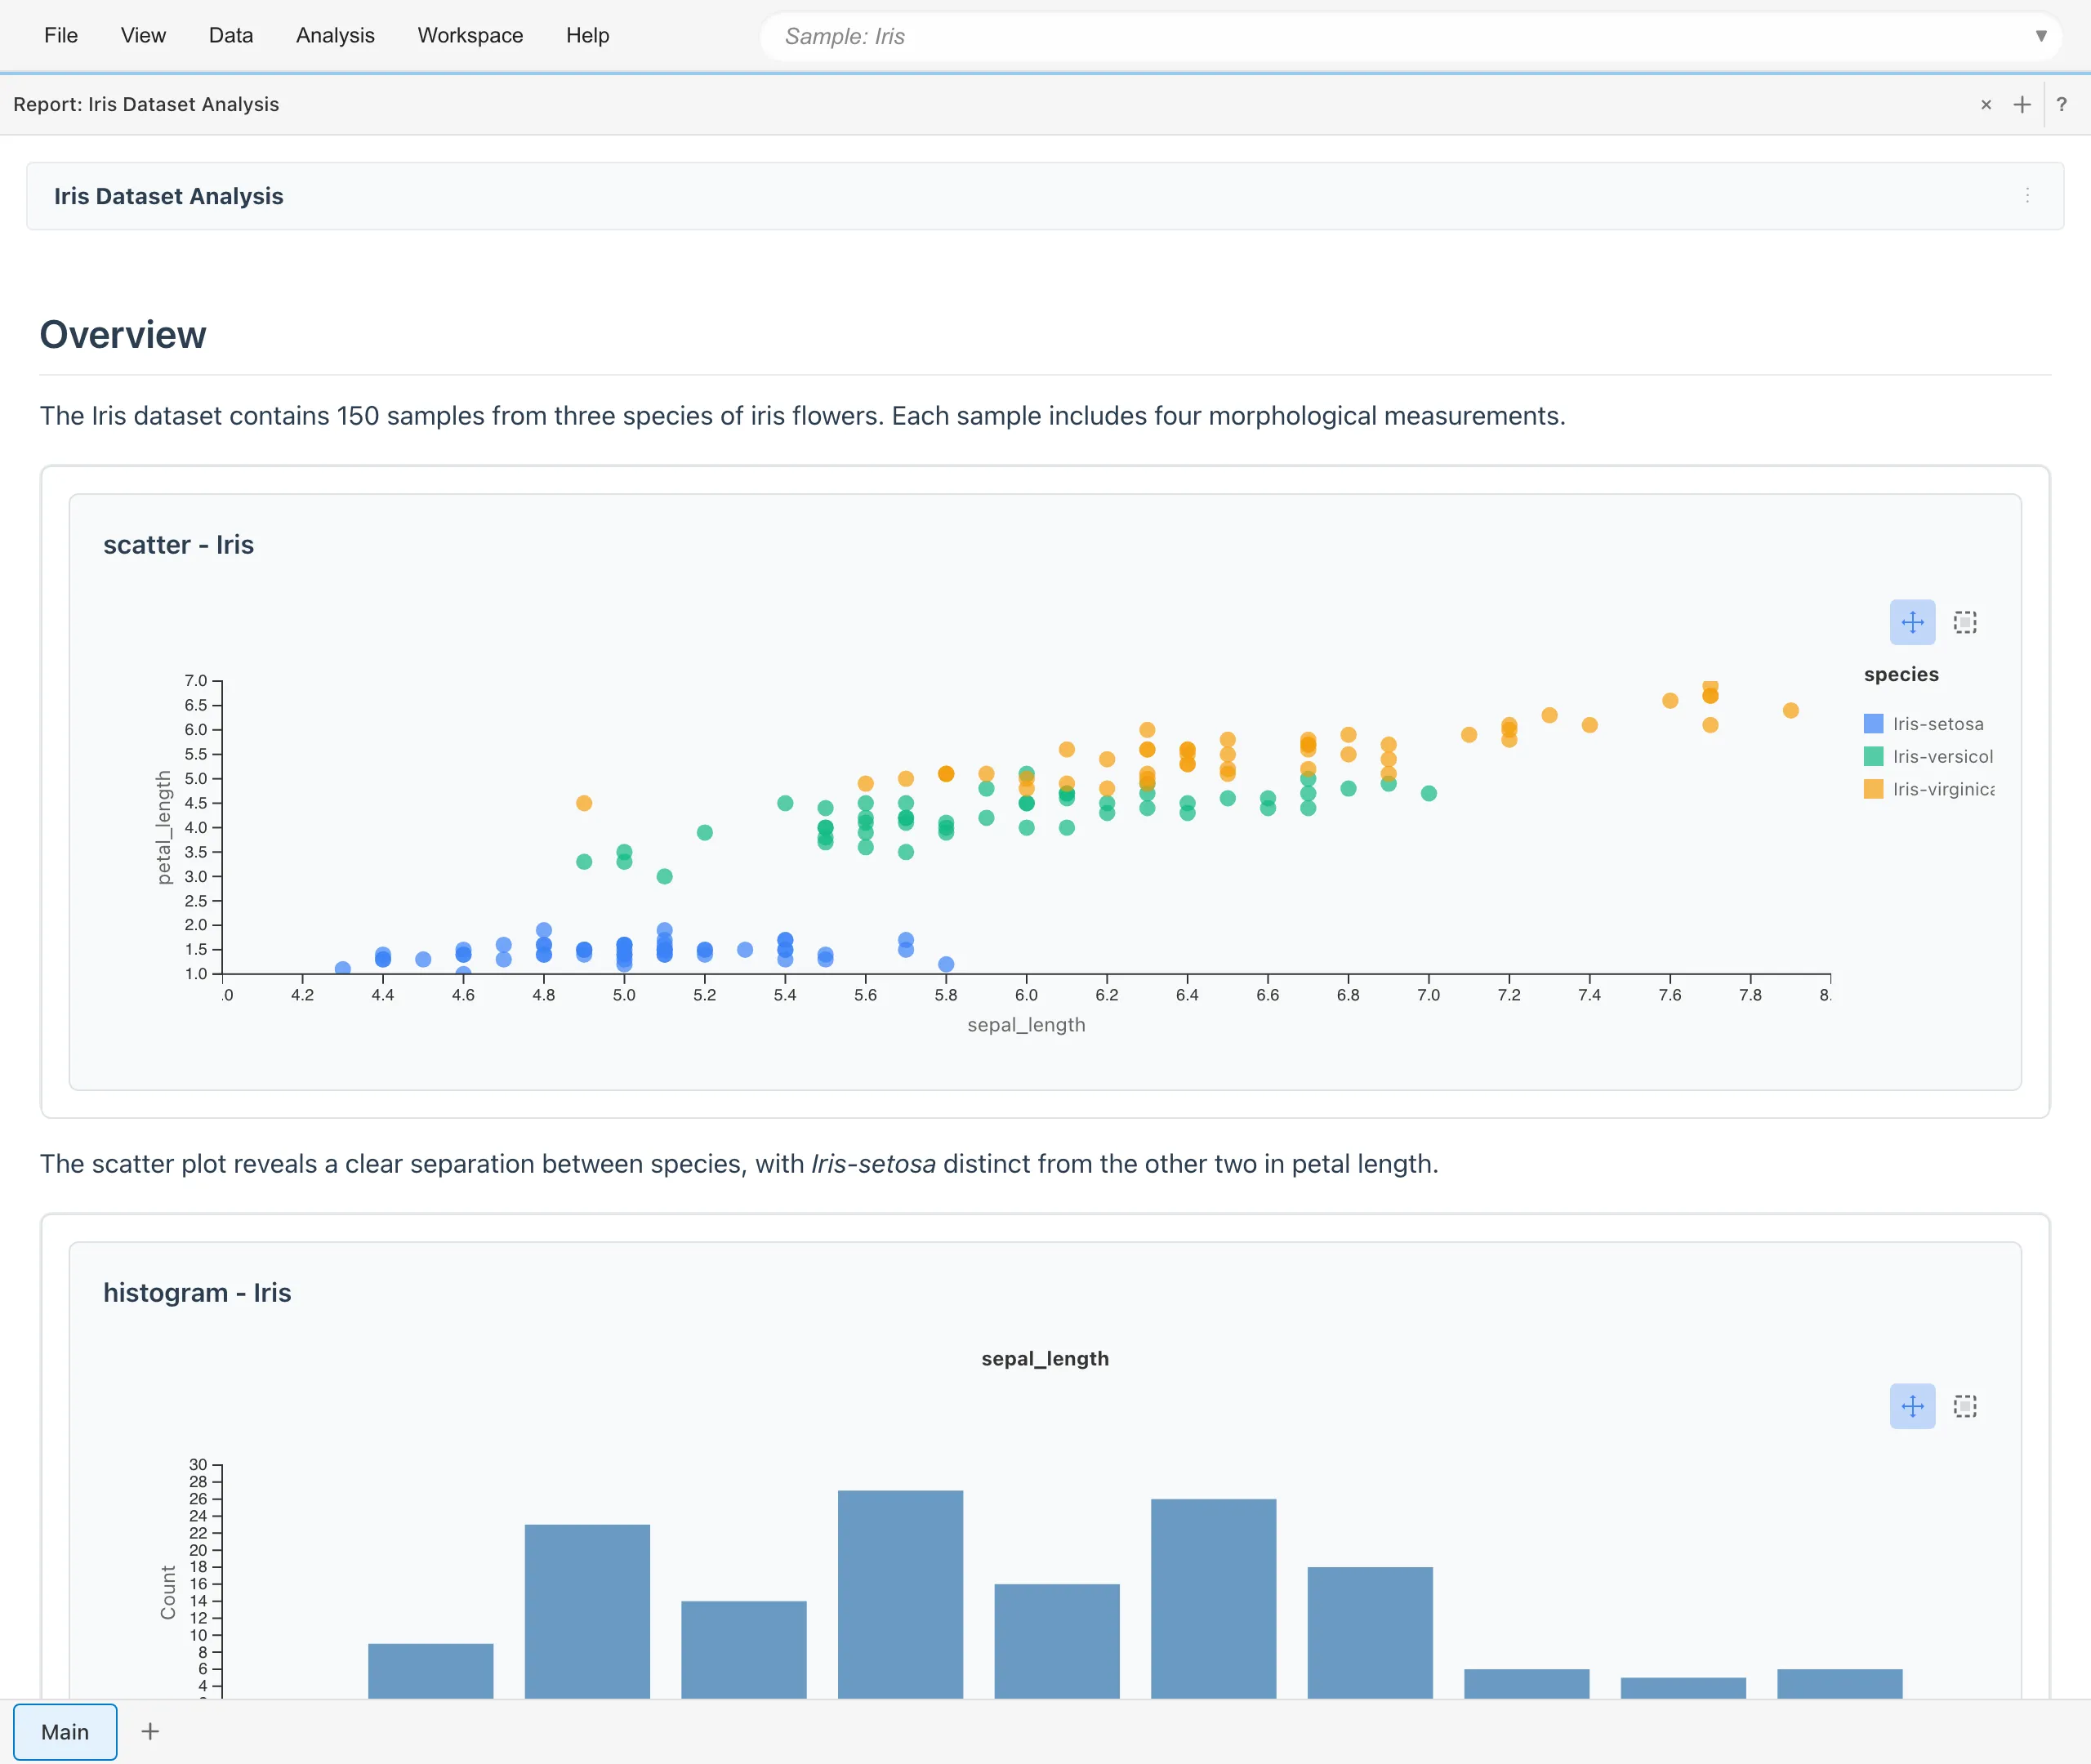
Add graphs created in Graph Builder or Statistics tabs to your reports.
- Add to Report button: Select from the Graph Builder or Statistics tab toolbar
- Right-click menu: Right-click on a graph and select Add to Report
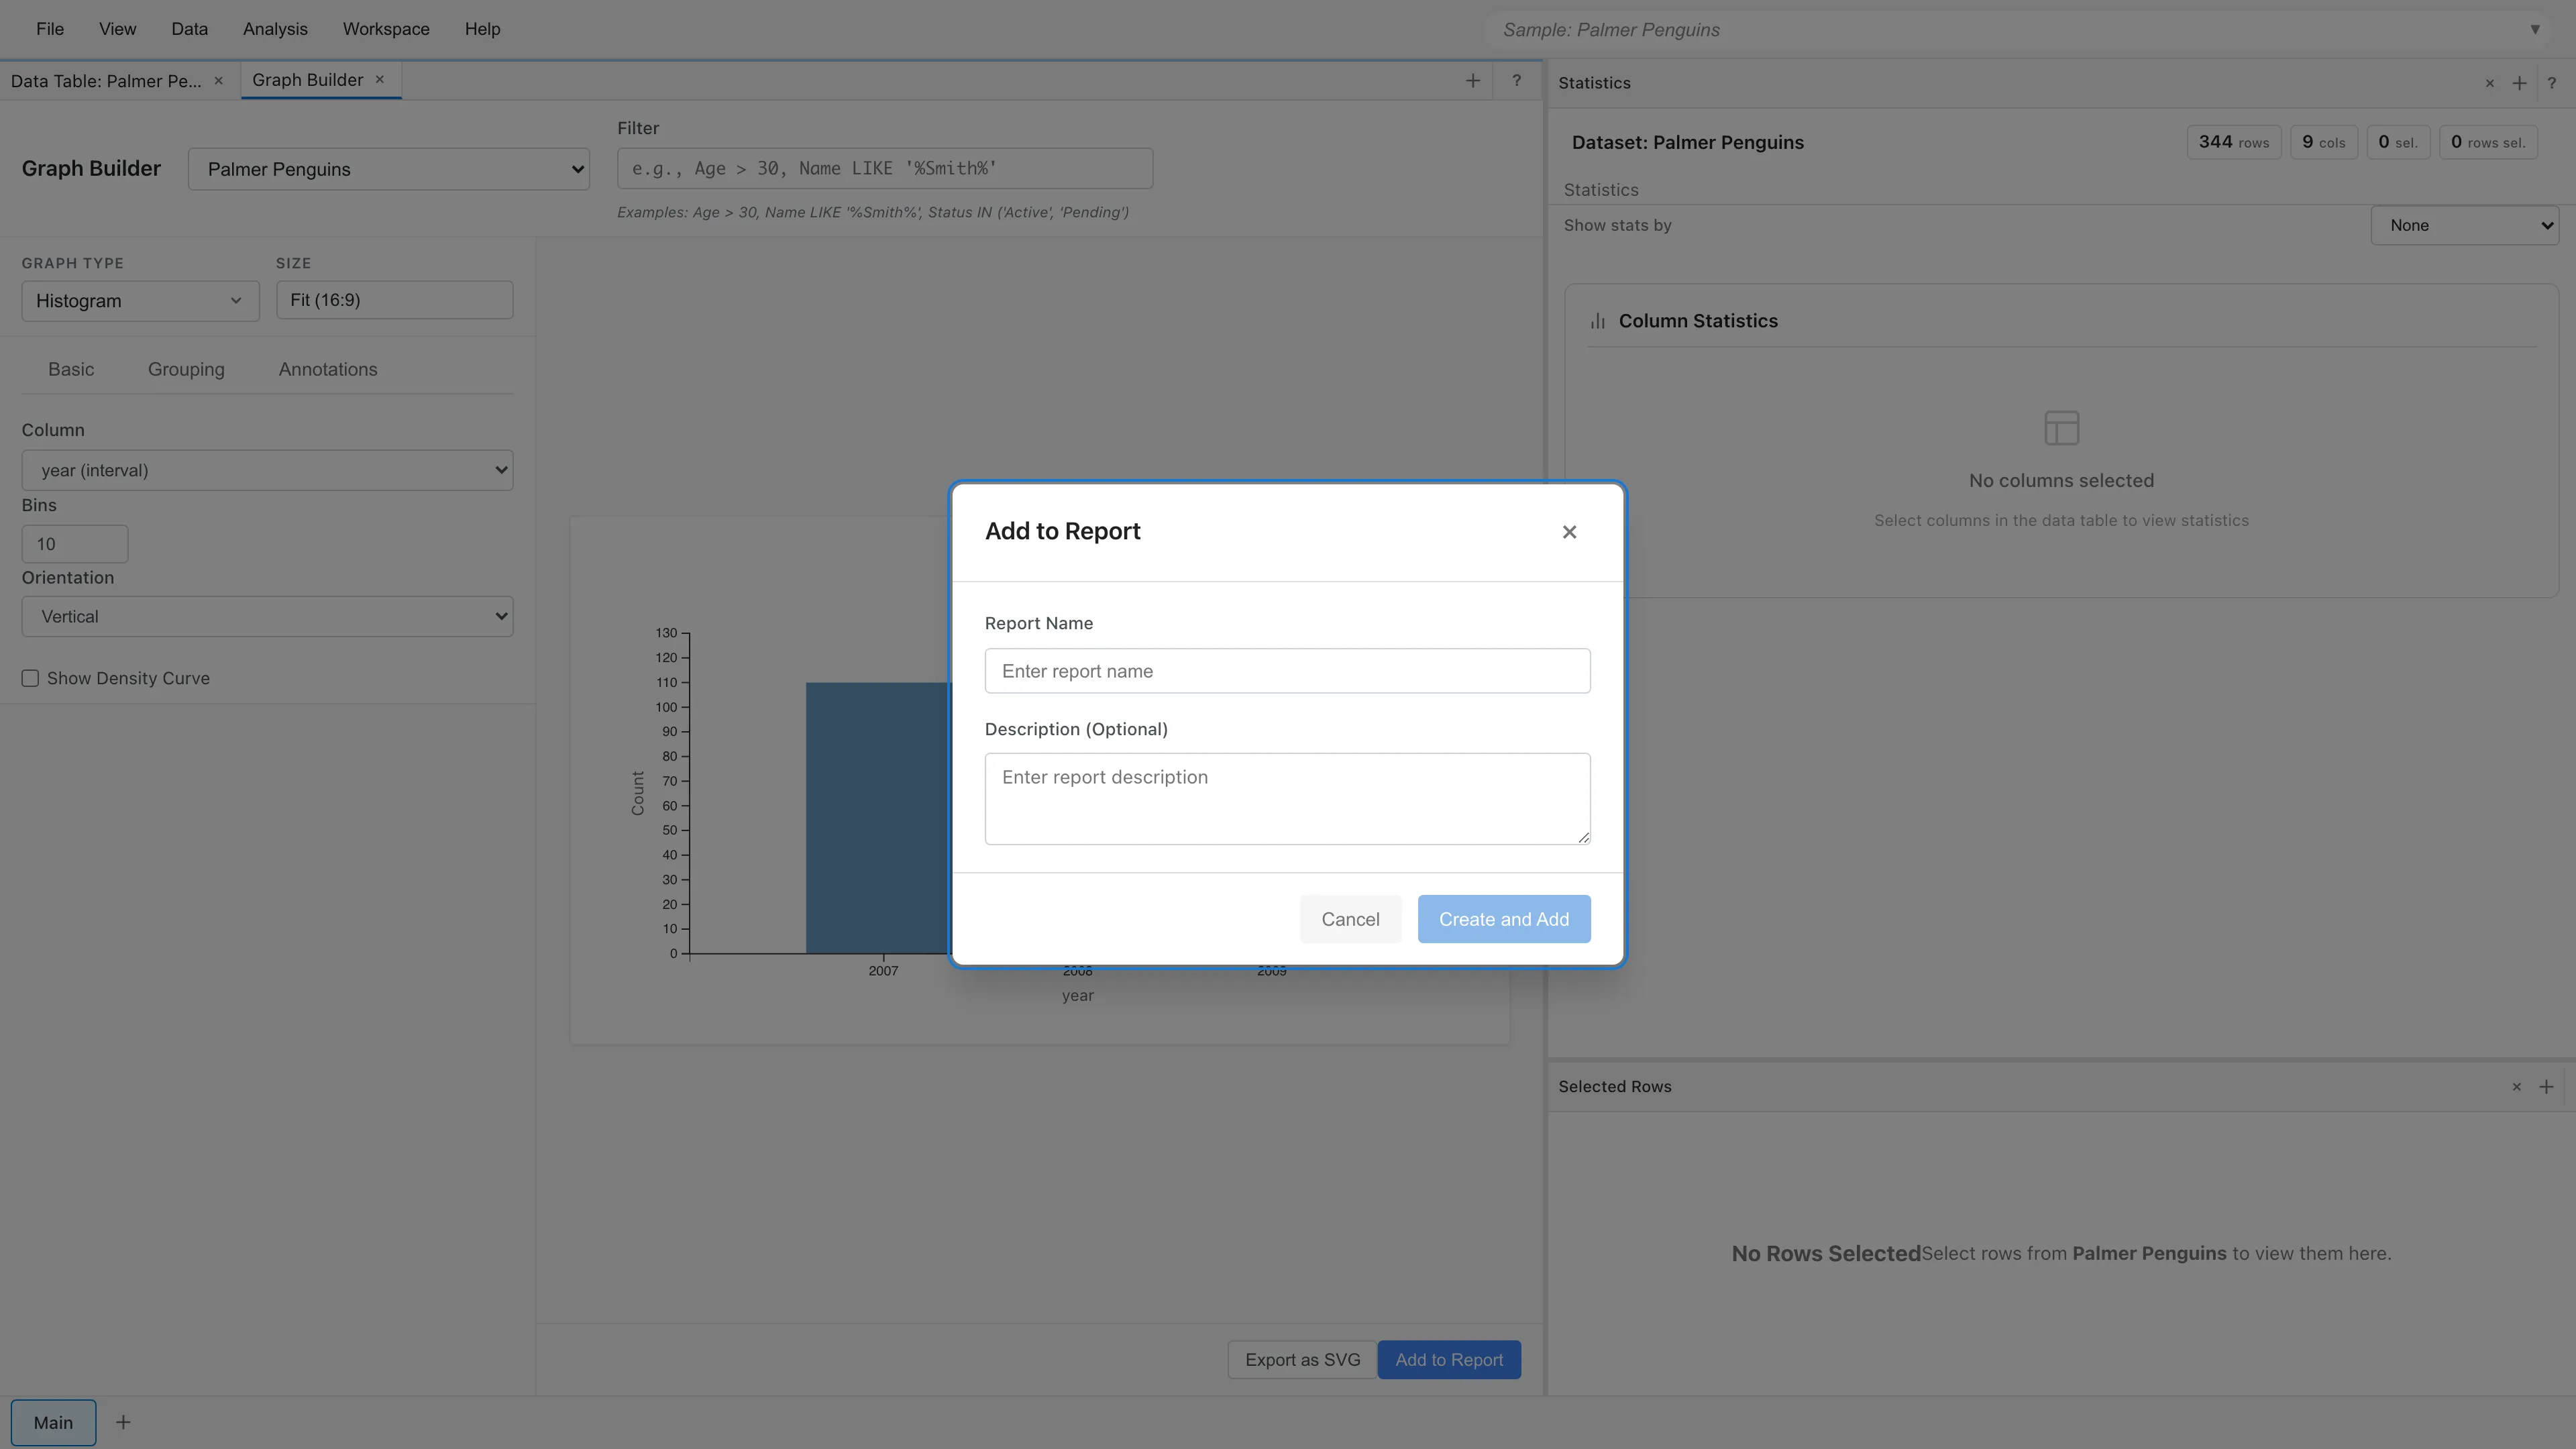
In the dialog, select an existing report or create a new one to add to.
Editing Reports
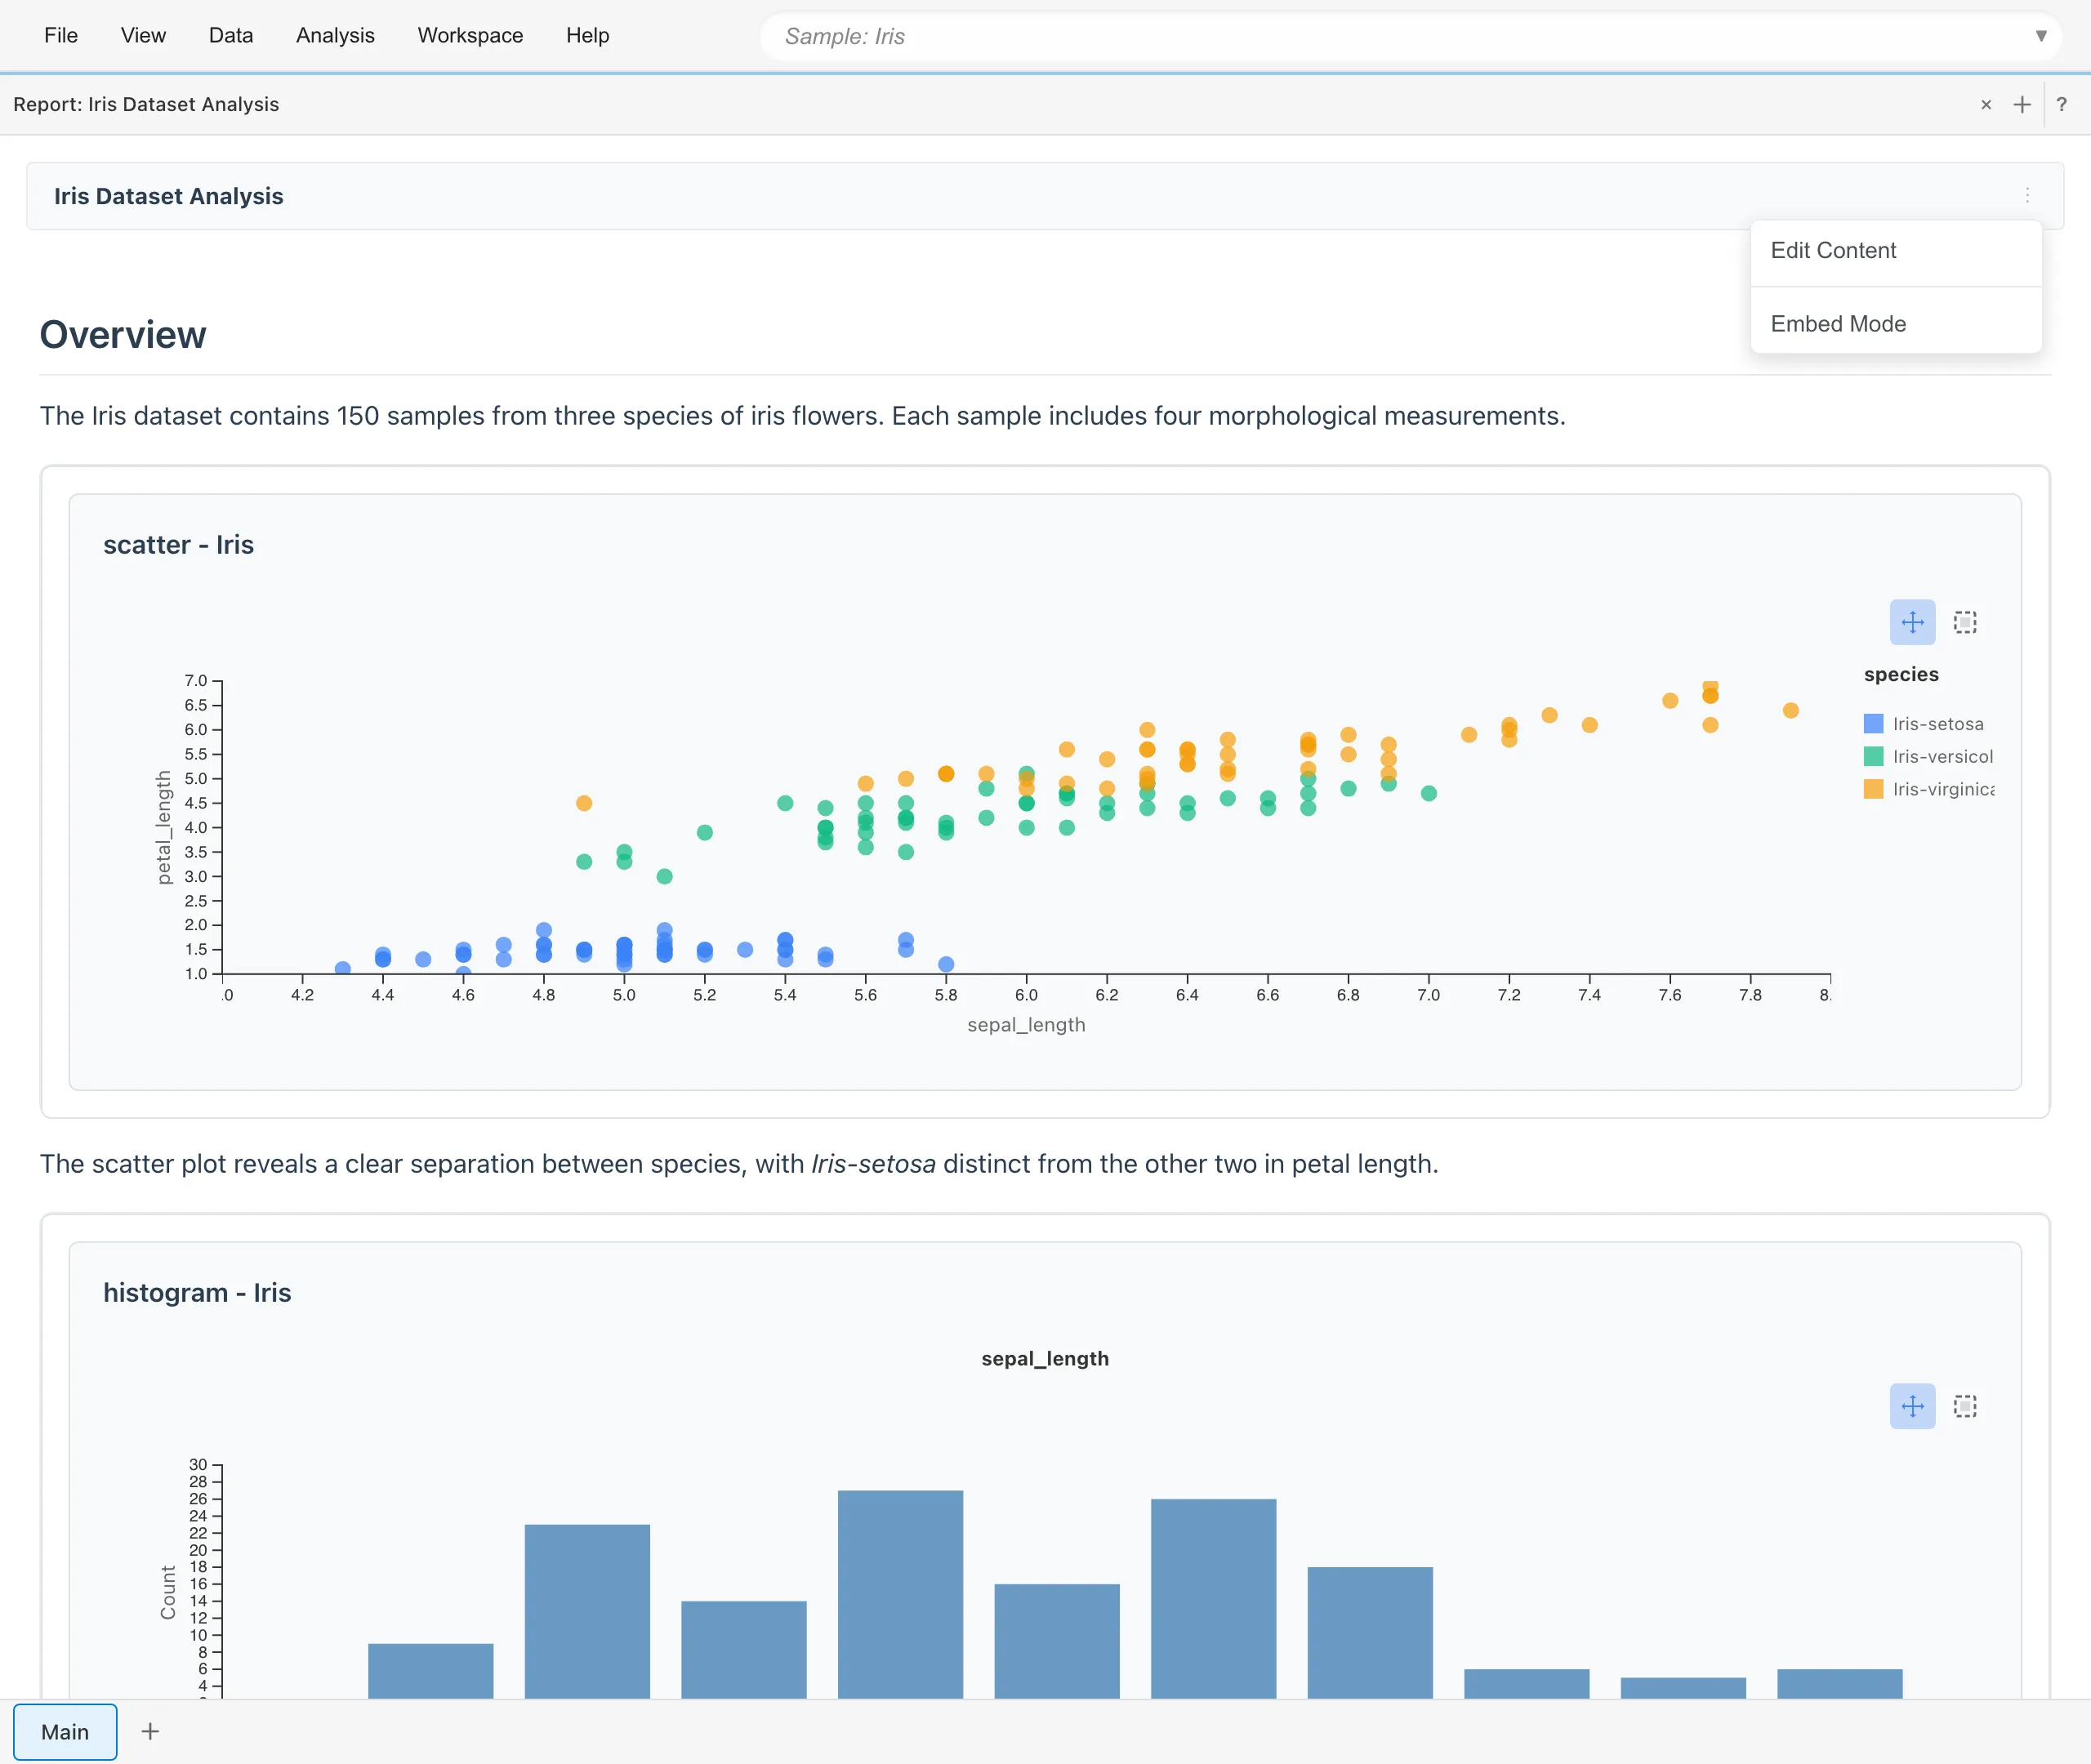
Select Edit Content from the ⋮ menu in the report header to open the editor.
Report Header Menu
- Edit Content - Open the Markdown editor to edit the report
- Embed Mode - View the report in read-only mode
Markdown Editor
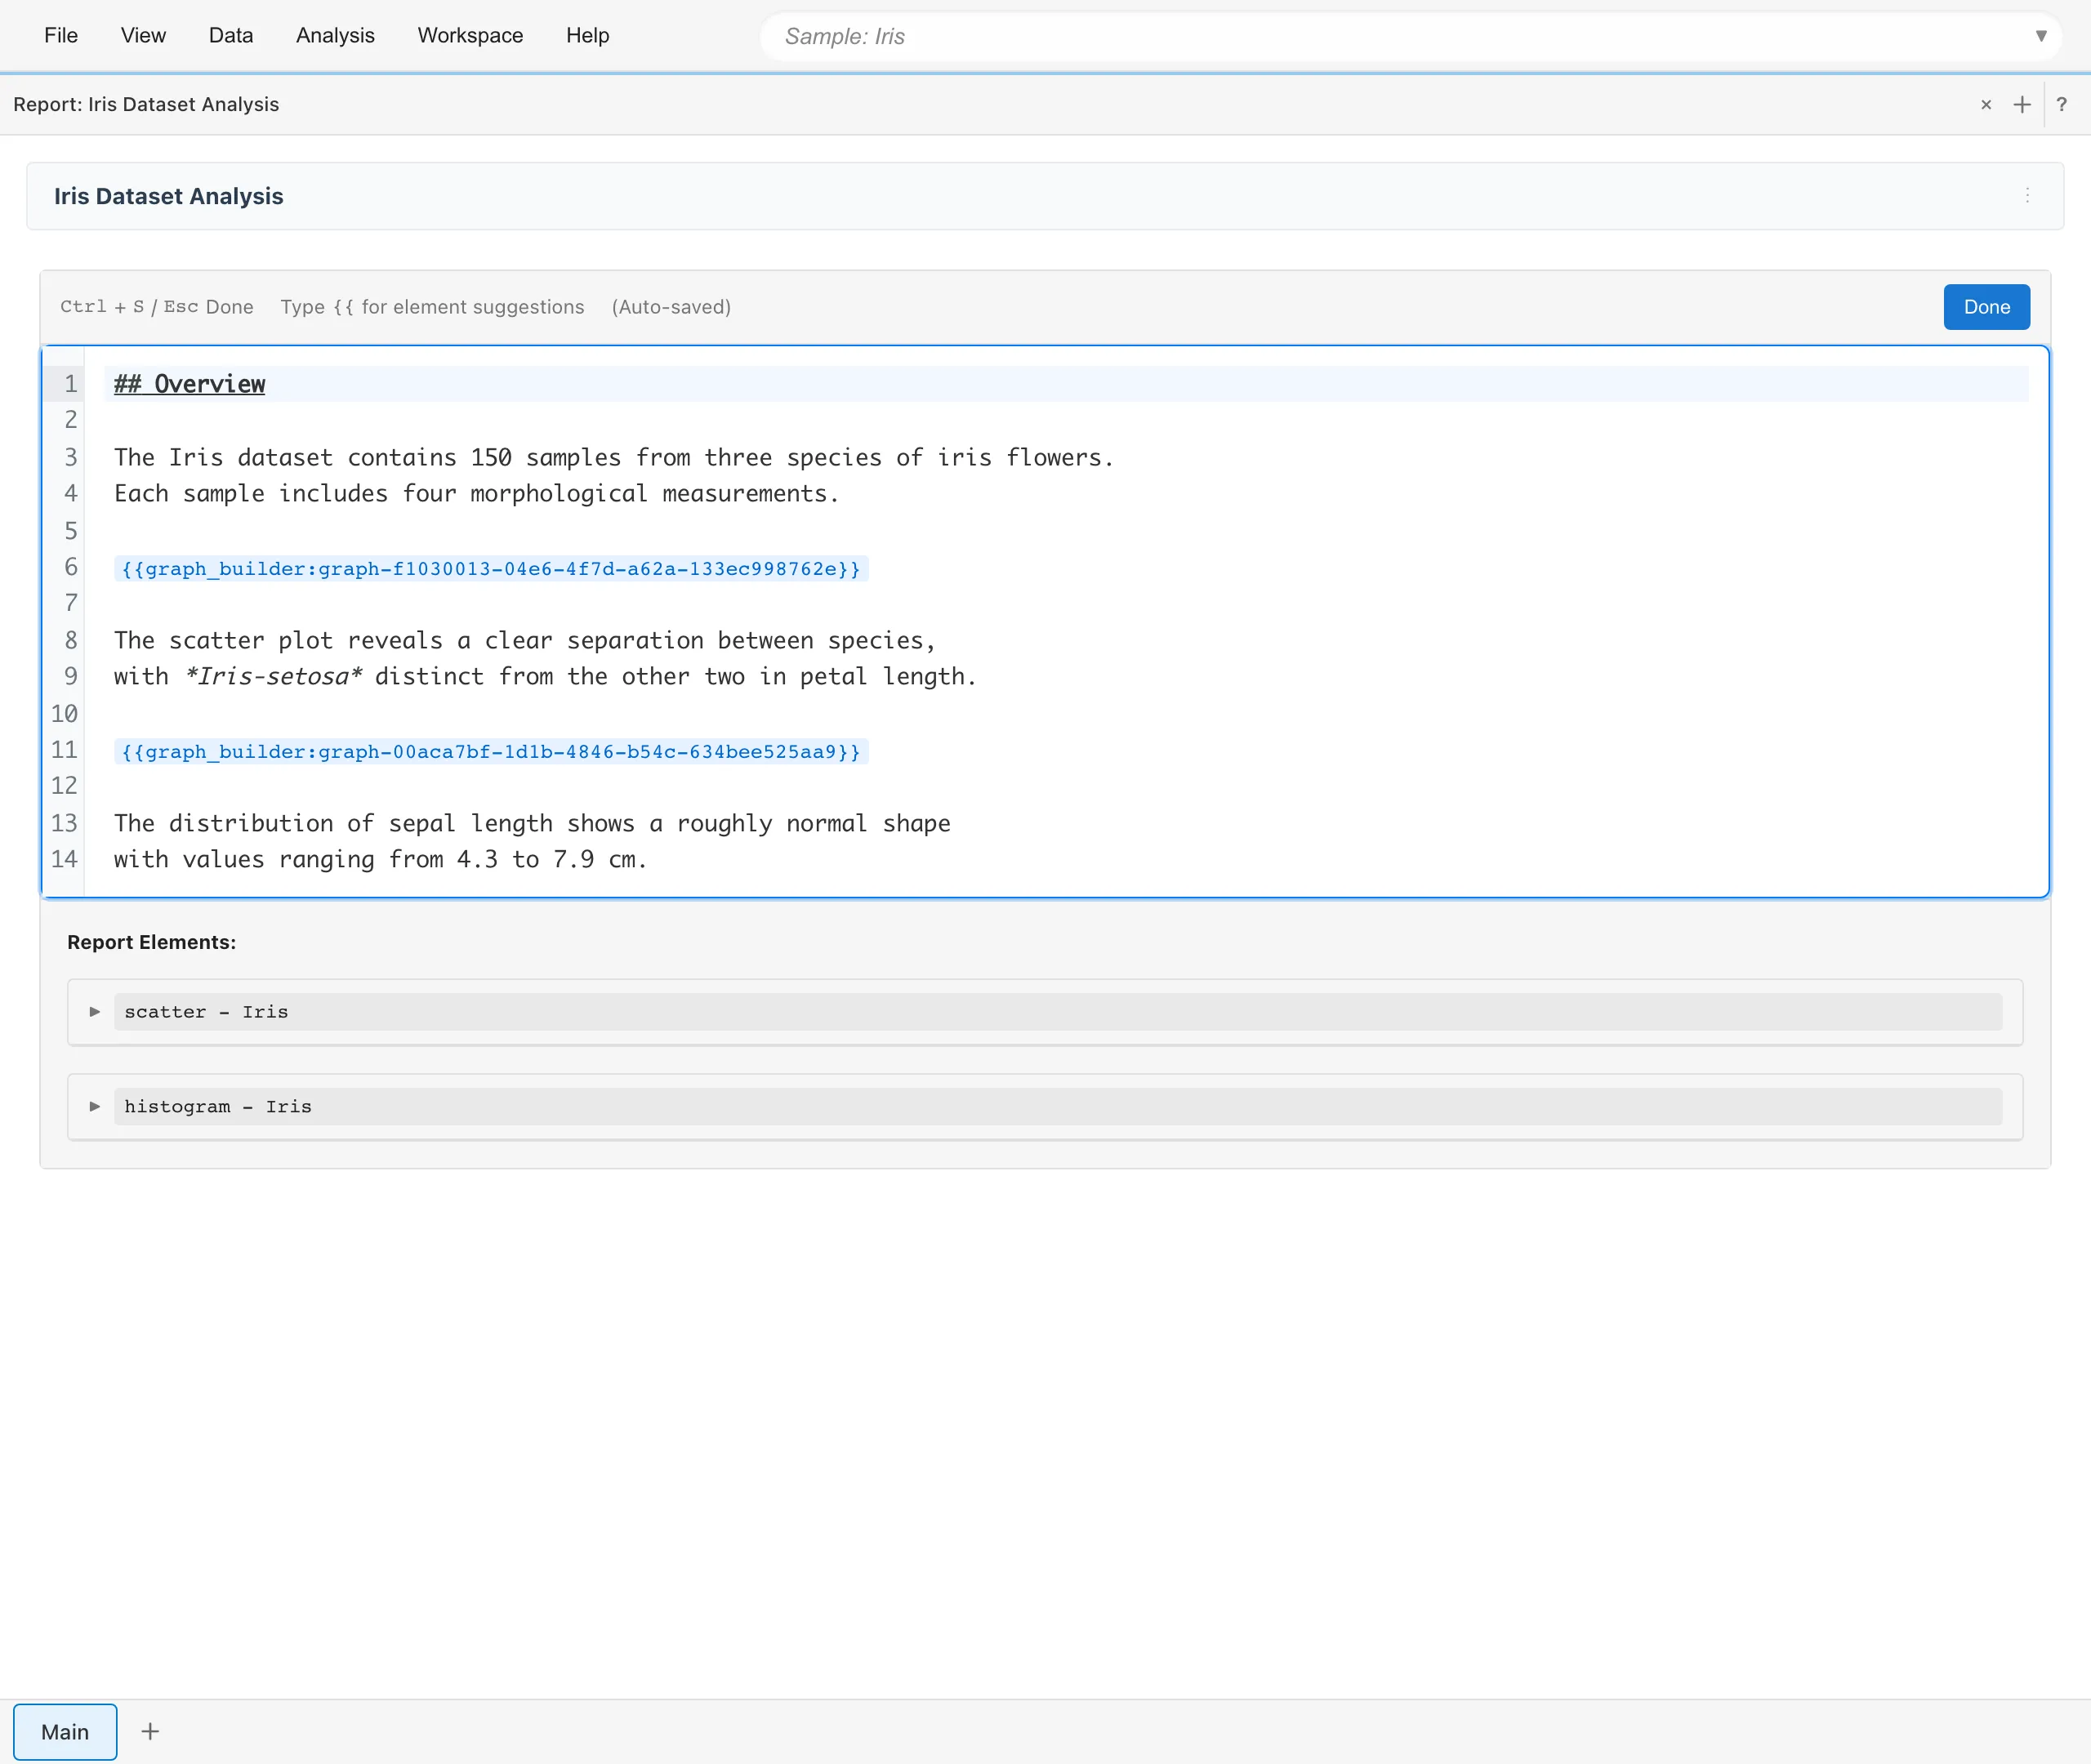
Reports use Markdown format. Embed elements using {{type:id}} syntax. Type {{ for autocomplete suggestions.
Press Cmd/Ctrl+S or Esc to close the editor (changes are auto-saved).
Element Menu
Each element has a menu (...) with the following options:
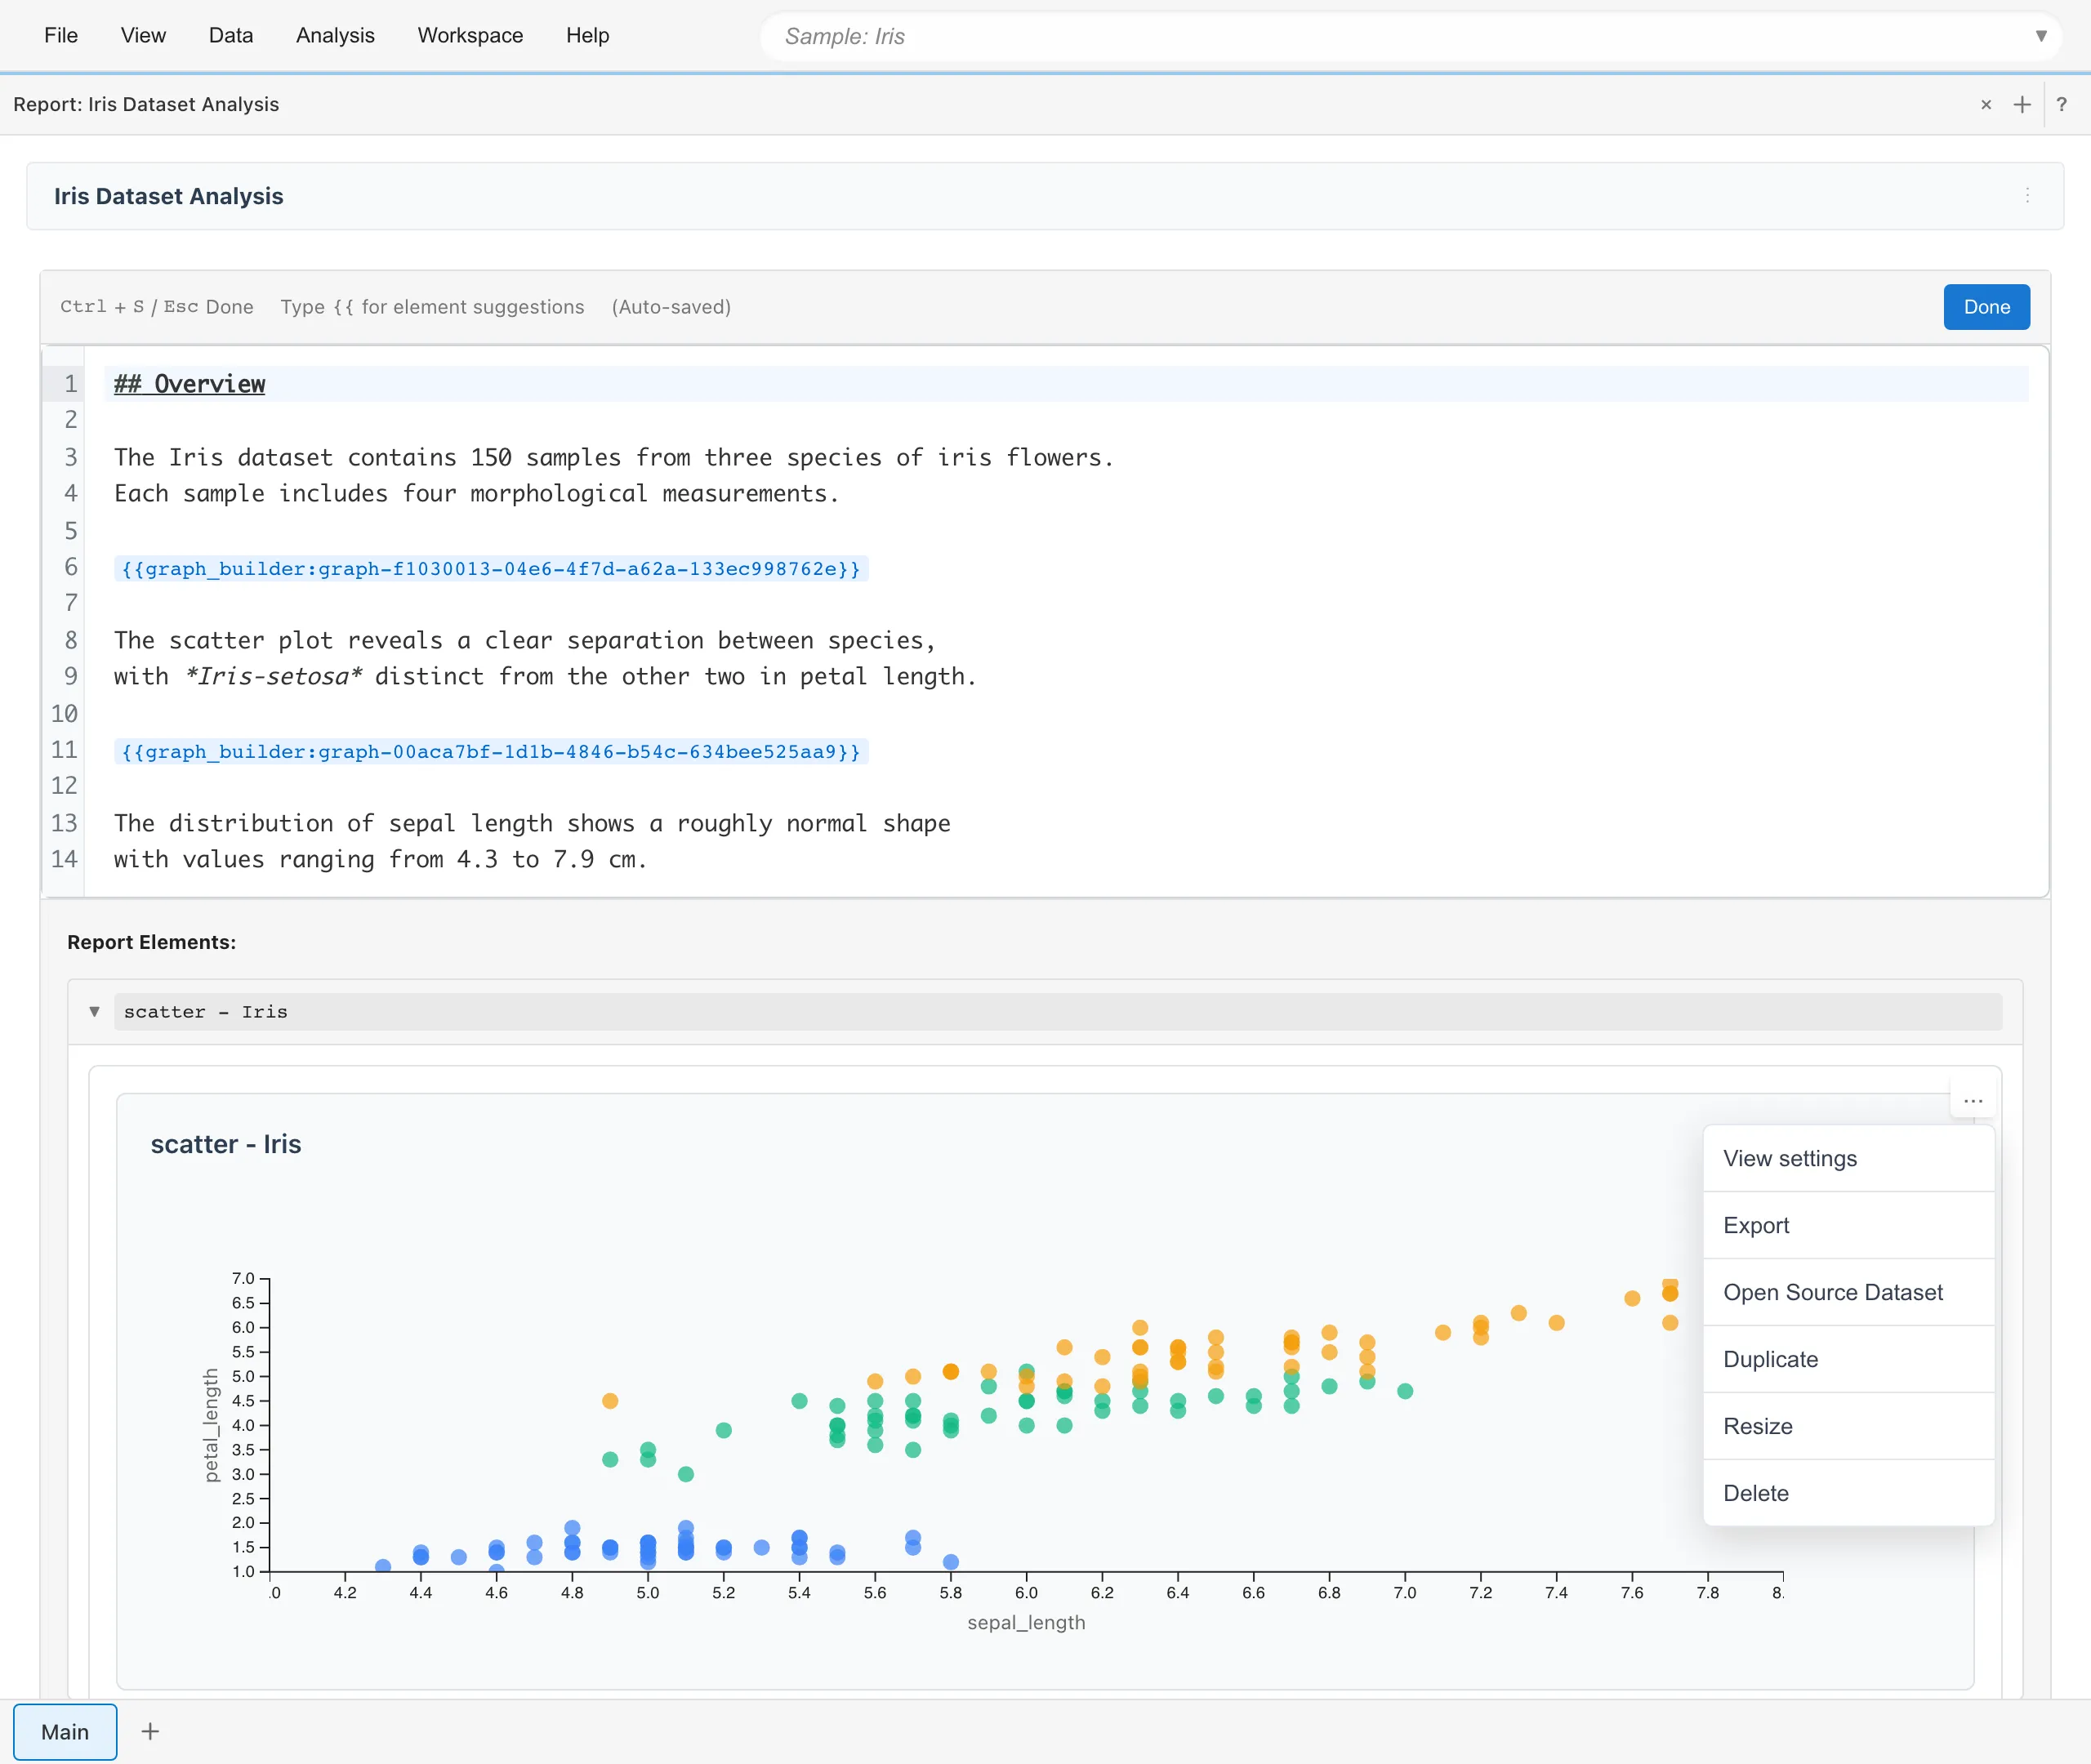
- View settings - Edit graph configuration
- Export - Download as SVG (graphs only)
- Open Source Dataset - Open the source dataset
- Duplicate - Create a copy
- Resize - Adjust size and aspect ratio
- Delete - Remove from report
Export
Graphs can be exported as SVG from the element menu. Direct export to Word or PDF is not available. To create a PDF, switch to Embed Mode and use the browser's print function to save as PDF.
Embed Mode
Select Embed Mode from the ⋮ menu in the report header to view the report in read-only mode. Editing UI is hidden and the layout is optimized for printing or taking screenshots.
See also
- Creating Graphs - Create graphs to add to reports
- Basic Statistics - View statistics to add to reports