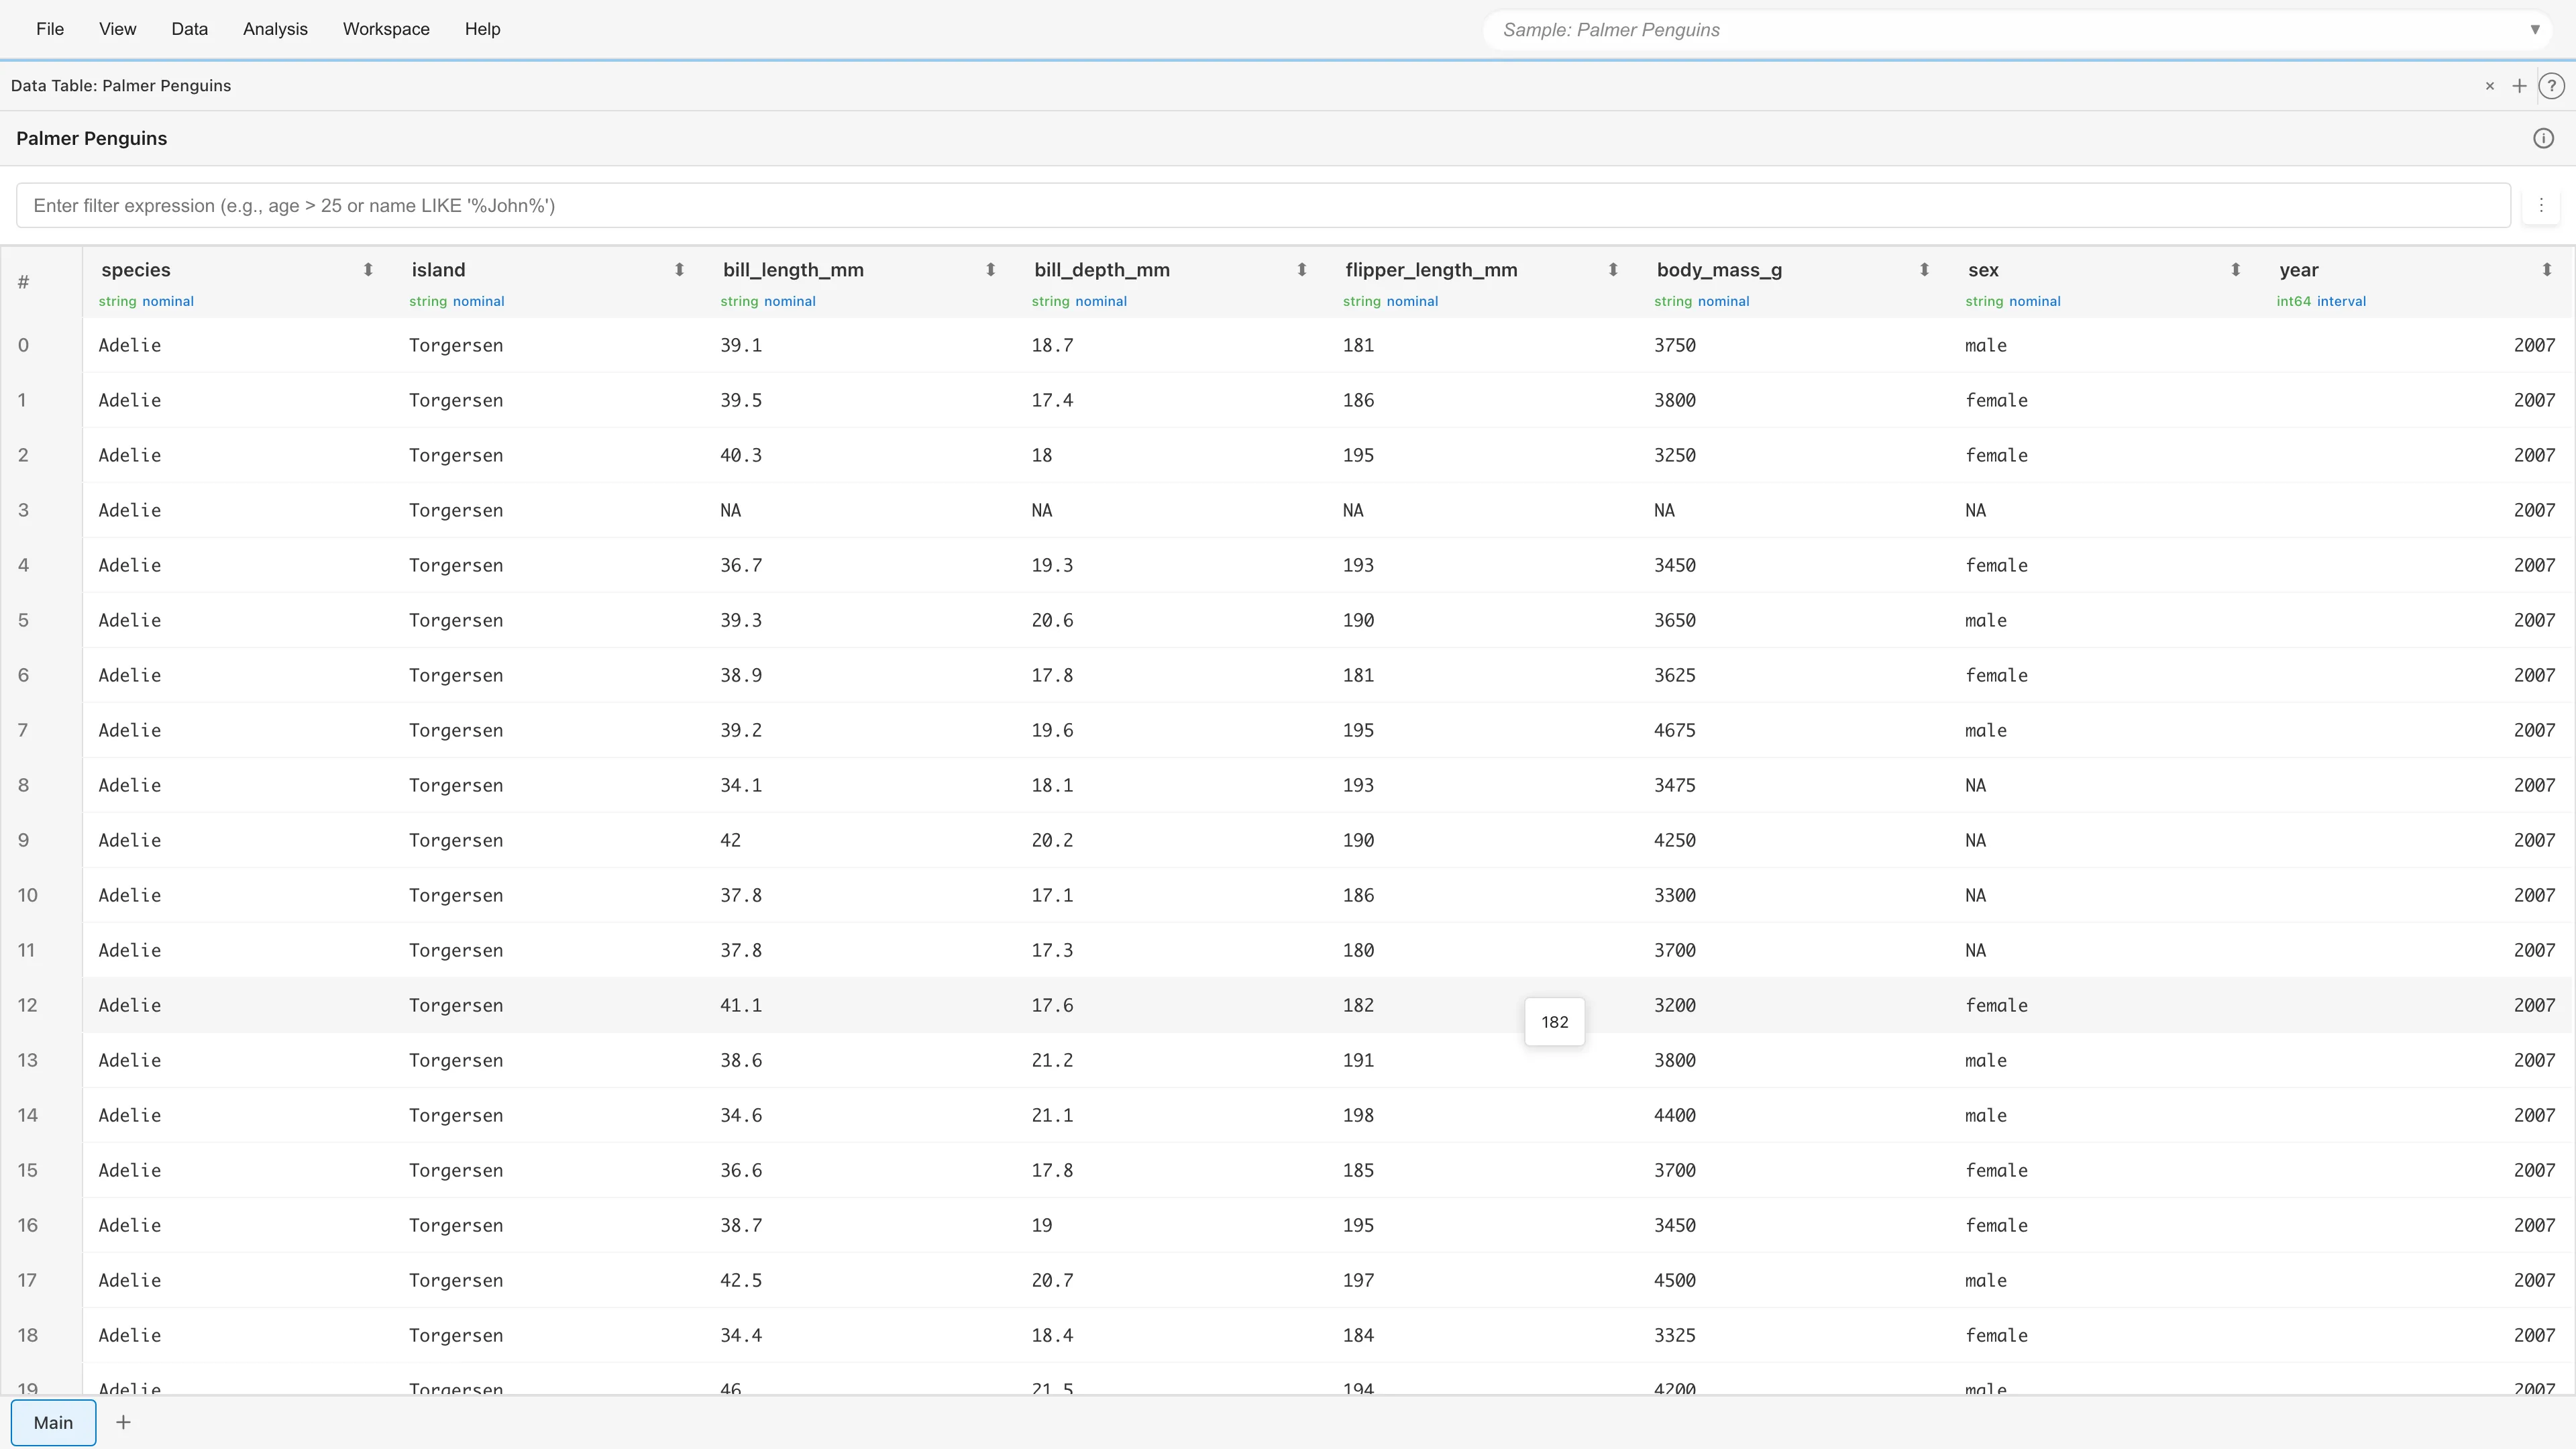
Data Table
The Data Table tab displays dataset contents in tabular format, allowing you to explore data using filters and sorting.
See also Getting Started.
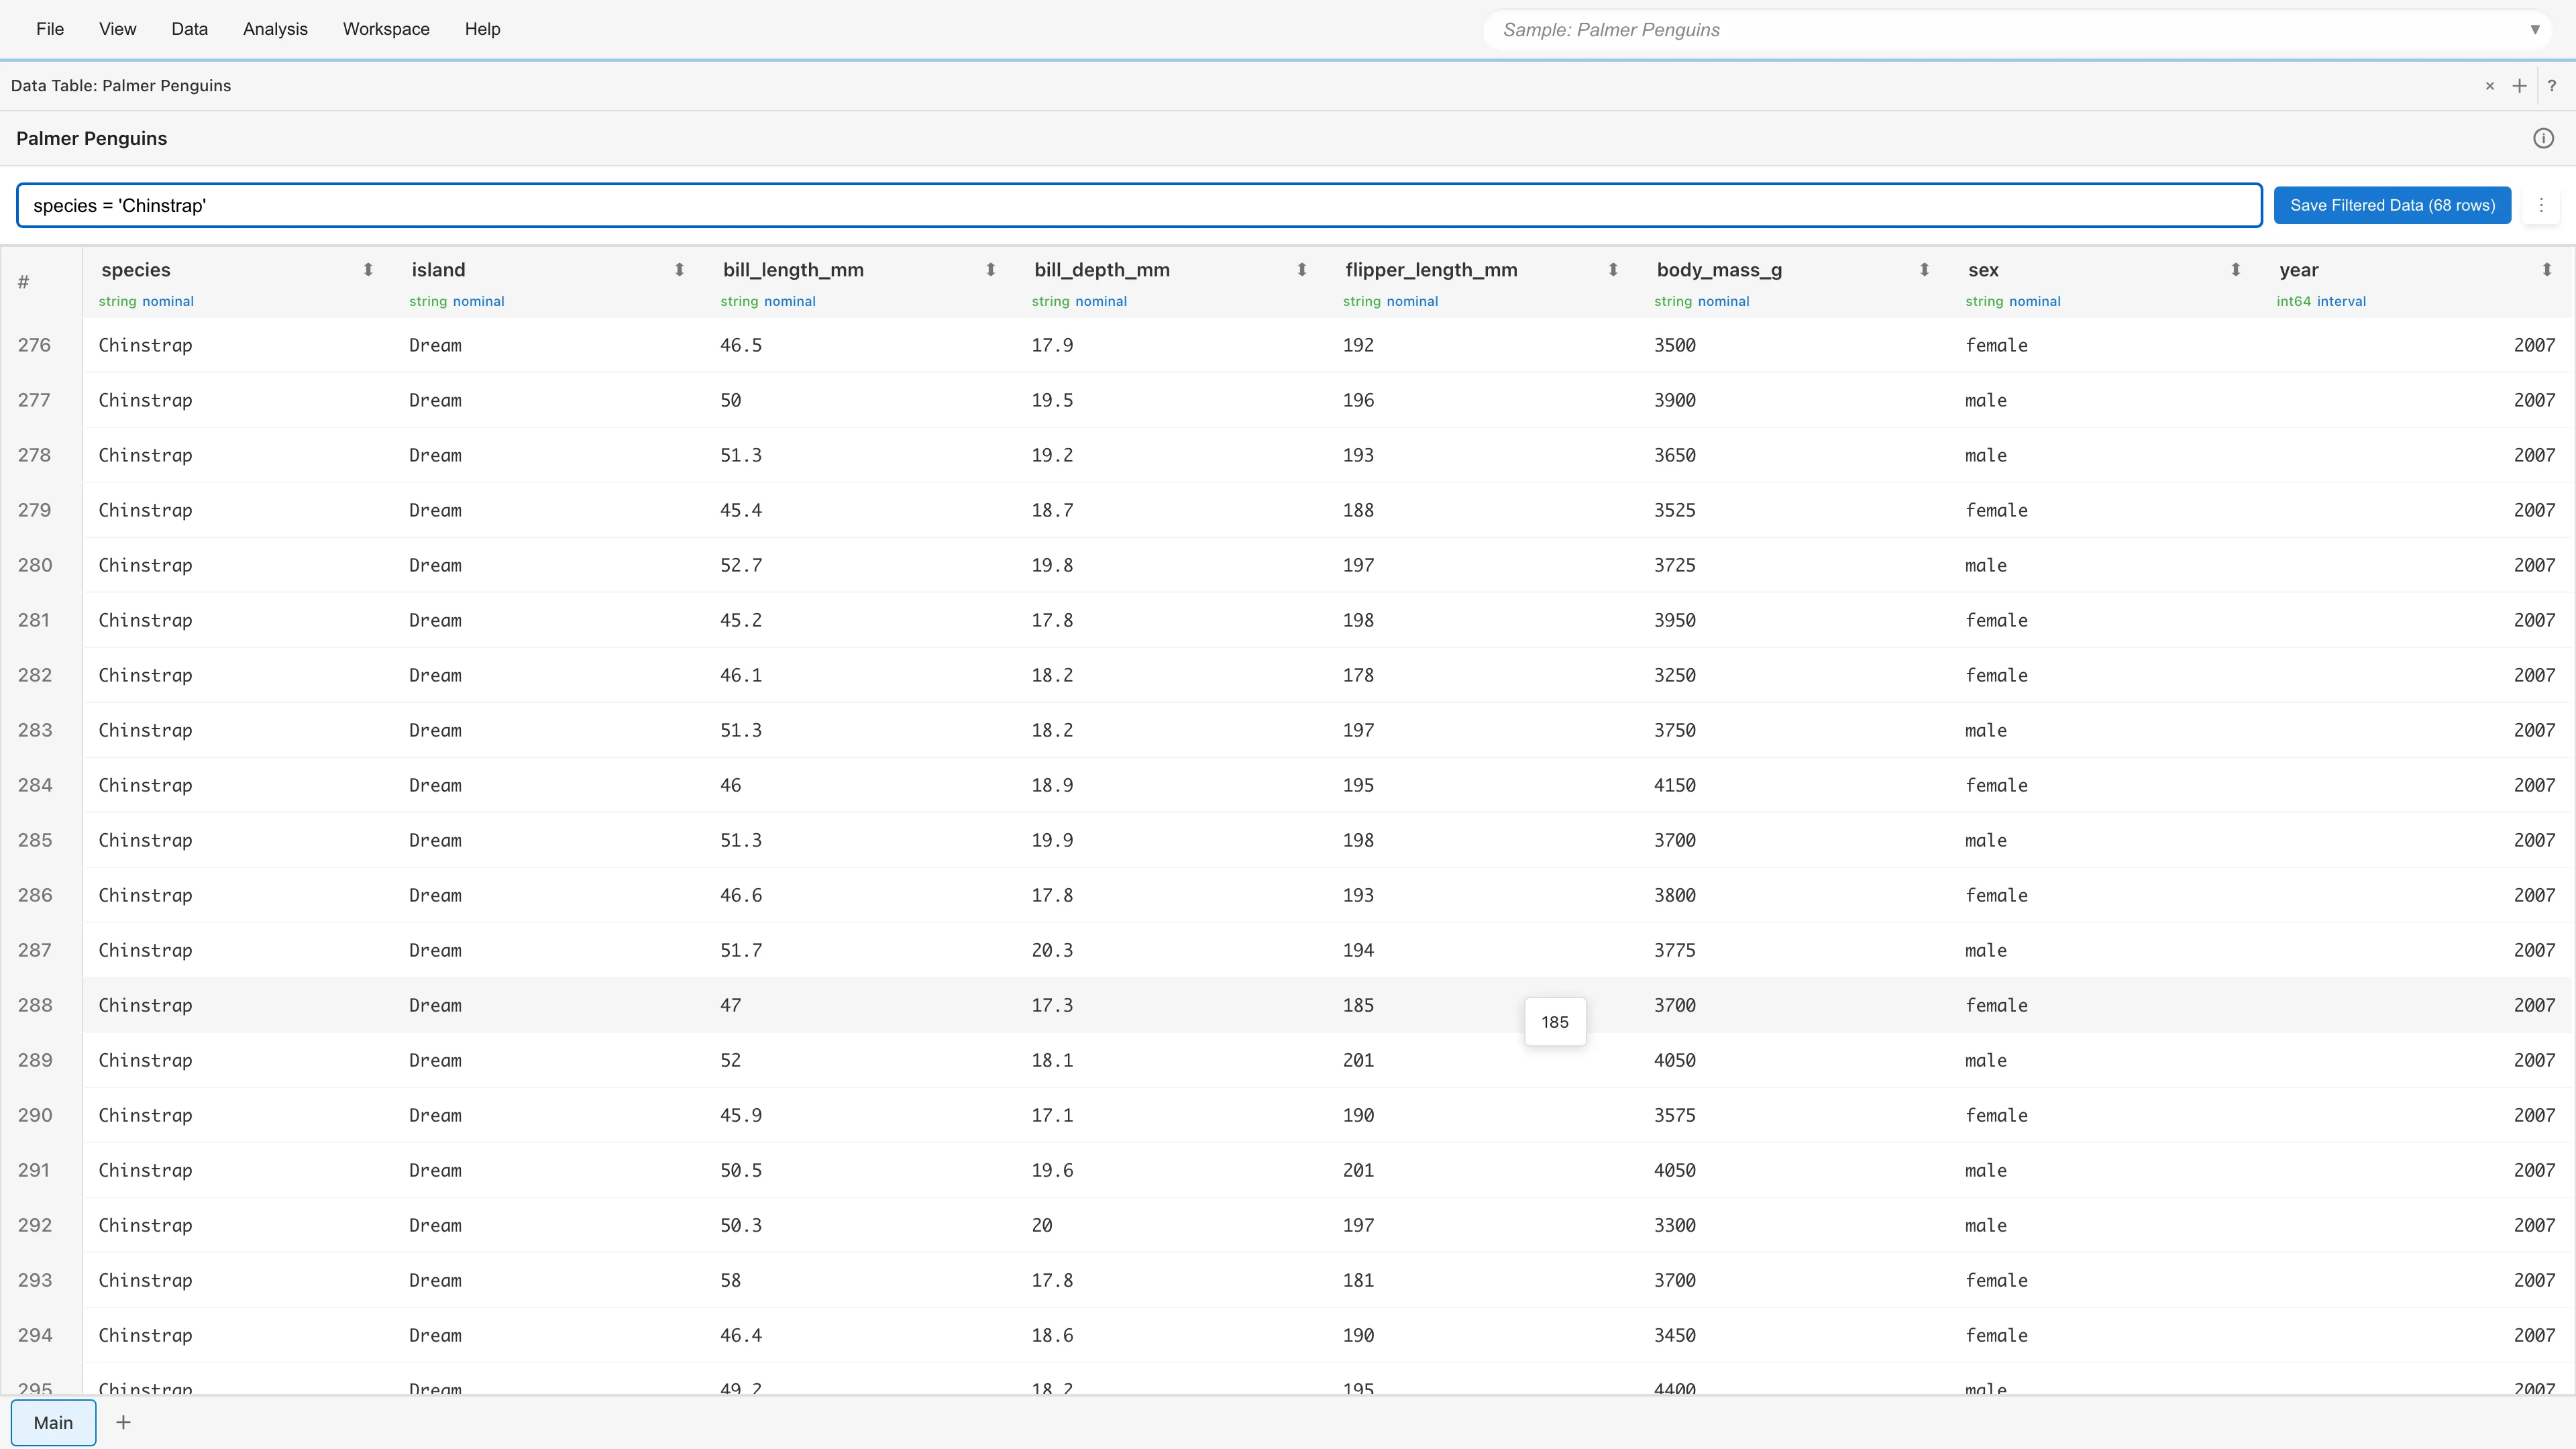
Filter Feature
Enter filter expressions to display only rows that match your conditions. Filters also apply to the Statistics tab, which computes statistics on the filtered data only.
Basic Usage
- Enter an expression in the filter input field at the top of the Data Table tab
- Press Enter or click outside the input field
- Only rows matching the condition are displayed
How to Write Filter Expressions
Filter expressions use SQL-like syntax supporting comparison operators, LIKE, IN, BETWEEN, and more. Enclose strings in single quotes and column names in double quotes.
Comparison Operators
| Operator | Meaning | Example |
|---|---|---|
= | Equal to | species = 'Adelie' |
!= | Not equal to | species != 'Adelie' |
> | Greater than | age > 30 |
>= | Greater or equal | age >= 30 |
< | Less than | age < 30 |
<= | Less or equal | age <= 30 |
Pattern Matching Operators
| Operator | Meaning | Example |
|---|---|---|
LIKE | Matches pattern (case-sensitive) | name LIKE '%田%' |
ILIKE | Matches pattern (case-insensitive) | name ILIKE '%Smith%' |
NOT LIKE | Does not match pattern | name NOT LIKE '%test%' |
Pattern syntax:
%represents any string (0 or more characters)_represents any single character
Examples:
name LIKE '%田%'- Contains "田"name LIKE '山%'- Starts with "山"name LIKE '%郎'- Ends with "郎"email LIKE '%@example.com'- Ends with @example.com
Logical Operators
| Operator | Meaning | Example |
|---|---|---|
and | And | age > 30 and sex = 'male' |
or | Or | species = 'Adelie' or species = 'Gentoo' |
() | Grouping | (age > 30 or salary > 50000) and active = true |
Set and Range Operators
| Operator | Meaning | Example |
|---|---|---|
IN (...) | In list of values | species IN ('Adelie', 'Chinstrap') |
NOT IN (...) | Not in list of values | status NOT IN ('deleted', 'archived') |
BETWEEN ... AND ... | Within range (inclusive) | age BETWEEN 20 AND 30 |
NOT BETWEEN ... AND ... | Outside range | age NOT BETWEEN 20 AND 30 |
Negation Operator
| Operator | Meaning | Example |
|---|---|---|
NOT (...) | Negates condition | NOT (status = 'deleted') |
NULL Check and Boolean Values
| Syntax | Meaning | Example |
|---|---|---|
IS NULL | Is missing value | bill_length_mm IS NULL |
IS NOT NULL | Is not missing | bill_length_mm IS NOT NULL |
true / false | Boolean values | active = true |
Column Names with Spaces or Special Characters
Enclose column names in double quotes:
"Body Mass (g)" > 4000
Filter Examples
# Numeric condition
body_mass_g > 4000

# String condition (enclose in single quotes)
species = 'Chinstrap'

# Combining multiple conditions
species = 'Adelie' and body_mass_g > 3500

# Excluding missing values
bill_length_mm IS NOT NULL

# Pattern matching (partial match)
island LIKE '%Dream%'

# Matching multiple values
species IN ('Adelie', 'Gentoo')

# Range specification
body_mass_g BETWEEN 3500 AND 4500
For example, filtering with species IN ('Adelie', 'Gentoo') displays only the matching rows.
Sort Feature
Click the sort button on a column header to sort data by that column.
Single Column Sort
- 1 click: Ascending order
- 2 clicks: Descending order
- 3 clicks: Remove sort
Multi-Column Sort
Hold Ctrl/Cmd while clicking to sort by multiple columns.
- Ctrl/Cmd+click to add a sort condition (ascending)
- Ctrl/Cmd+click the same column again to switch to descending
- Ctrl/Cmd+click once more to remove the sort
During multi-column sort, priority numbers are displayed on sort buttons (e.g., 1, 2).
Row Selection
Selecting rows in the Data Table synchronizes the selection state with other tabs (Statistics, Graph Builder, etc.).
Selection Methods
- Single row: Click a row
- Range selection: Hold Shift while clicking
- Add to selection: Hold Ctrl/Cmd while clicking
- Deselect: Click a selected row, or click an empty area
Integration with Other Tabs
Rows selected in the Data Table synchronize with other tabs.
- Statistics tab — Shows statistics for selected rows only
- Graph Builder — Highlights selected rows
For example, you can select rows that appear to be outliers and examine them in the Statistics tab, or highlight only data meeting certain conditions on a graph.
Dataset Operations
Viewing Metadata
Click the ⓘ button next to the dataset name to view basic information about the dataset (dataset name, row and column counts, data type and measurement scale for each column).
Column Context Menu
Right-click a column header to open the context menu.
- Convert Column Types...: Open the type conversion tab. See Column Type Conversion for details.
- Edit Scale: Change the measurement scale.
- Rename Column: Rename the column.
Table Menu
Click the menu button (⋮) at the top right of the table to access dataset operations.
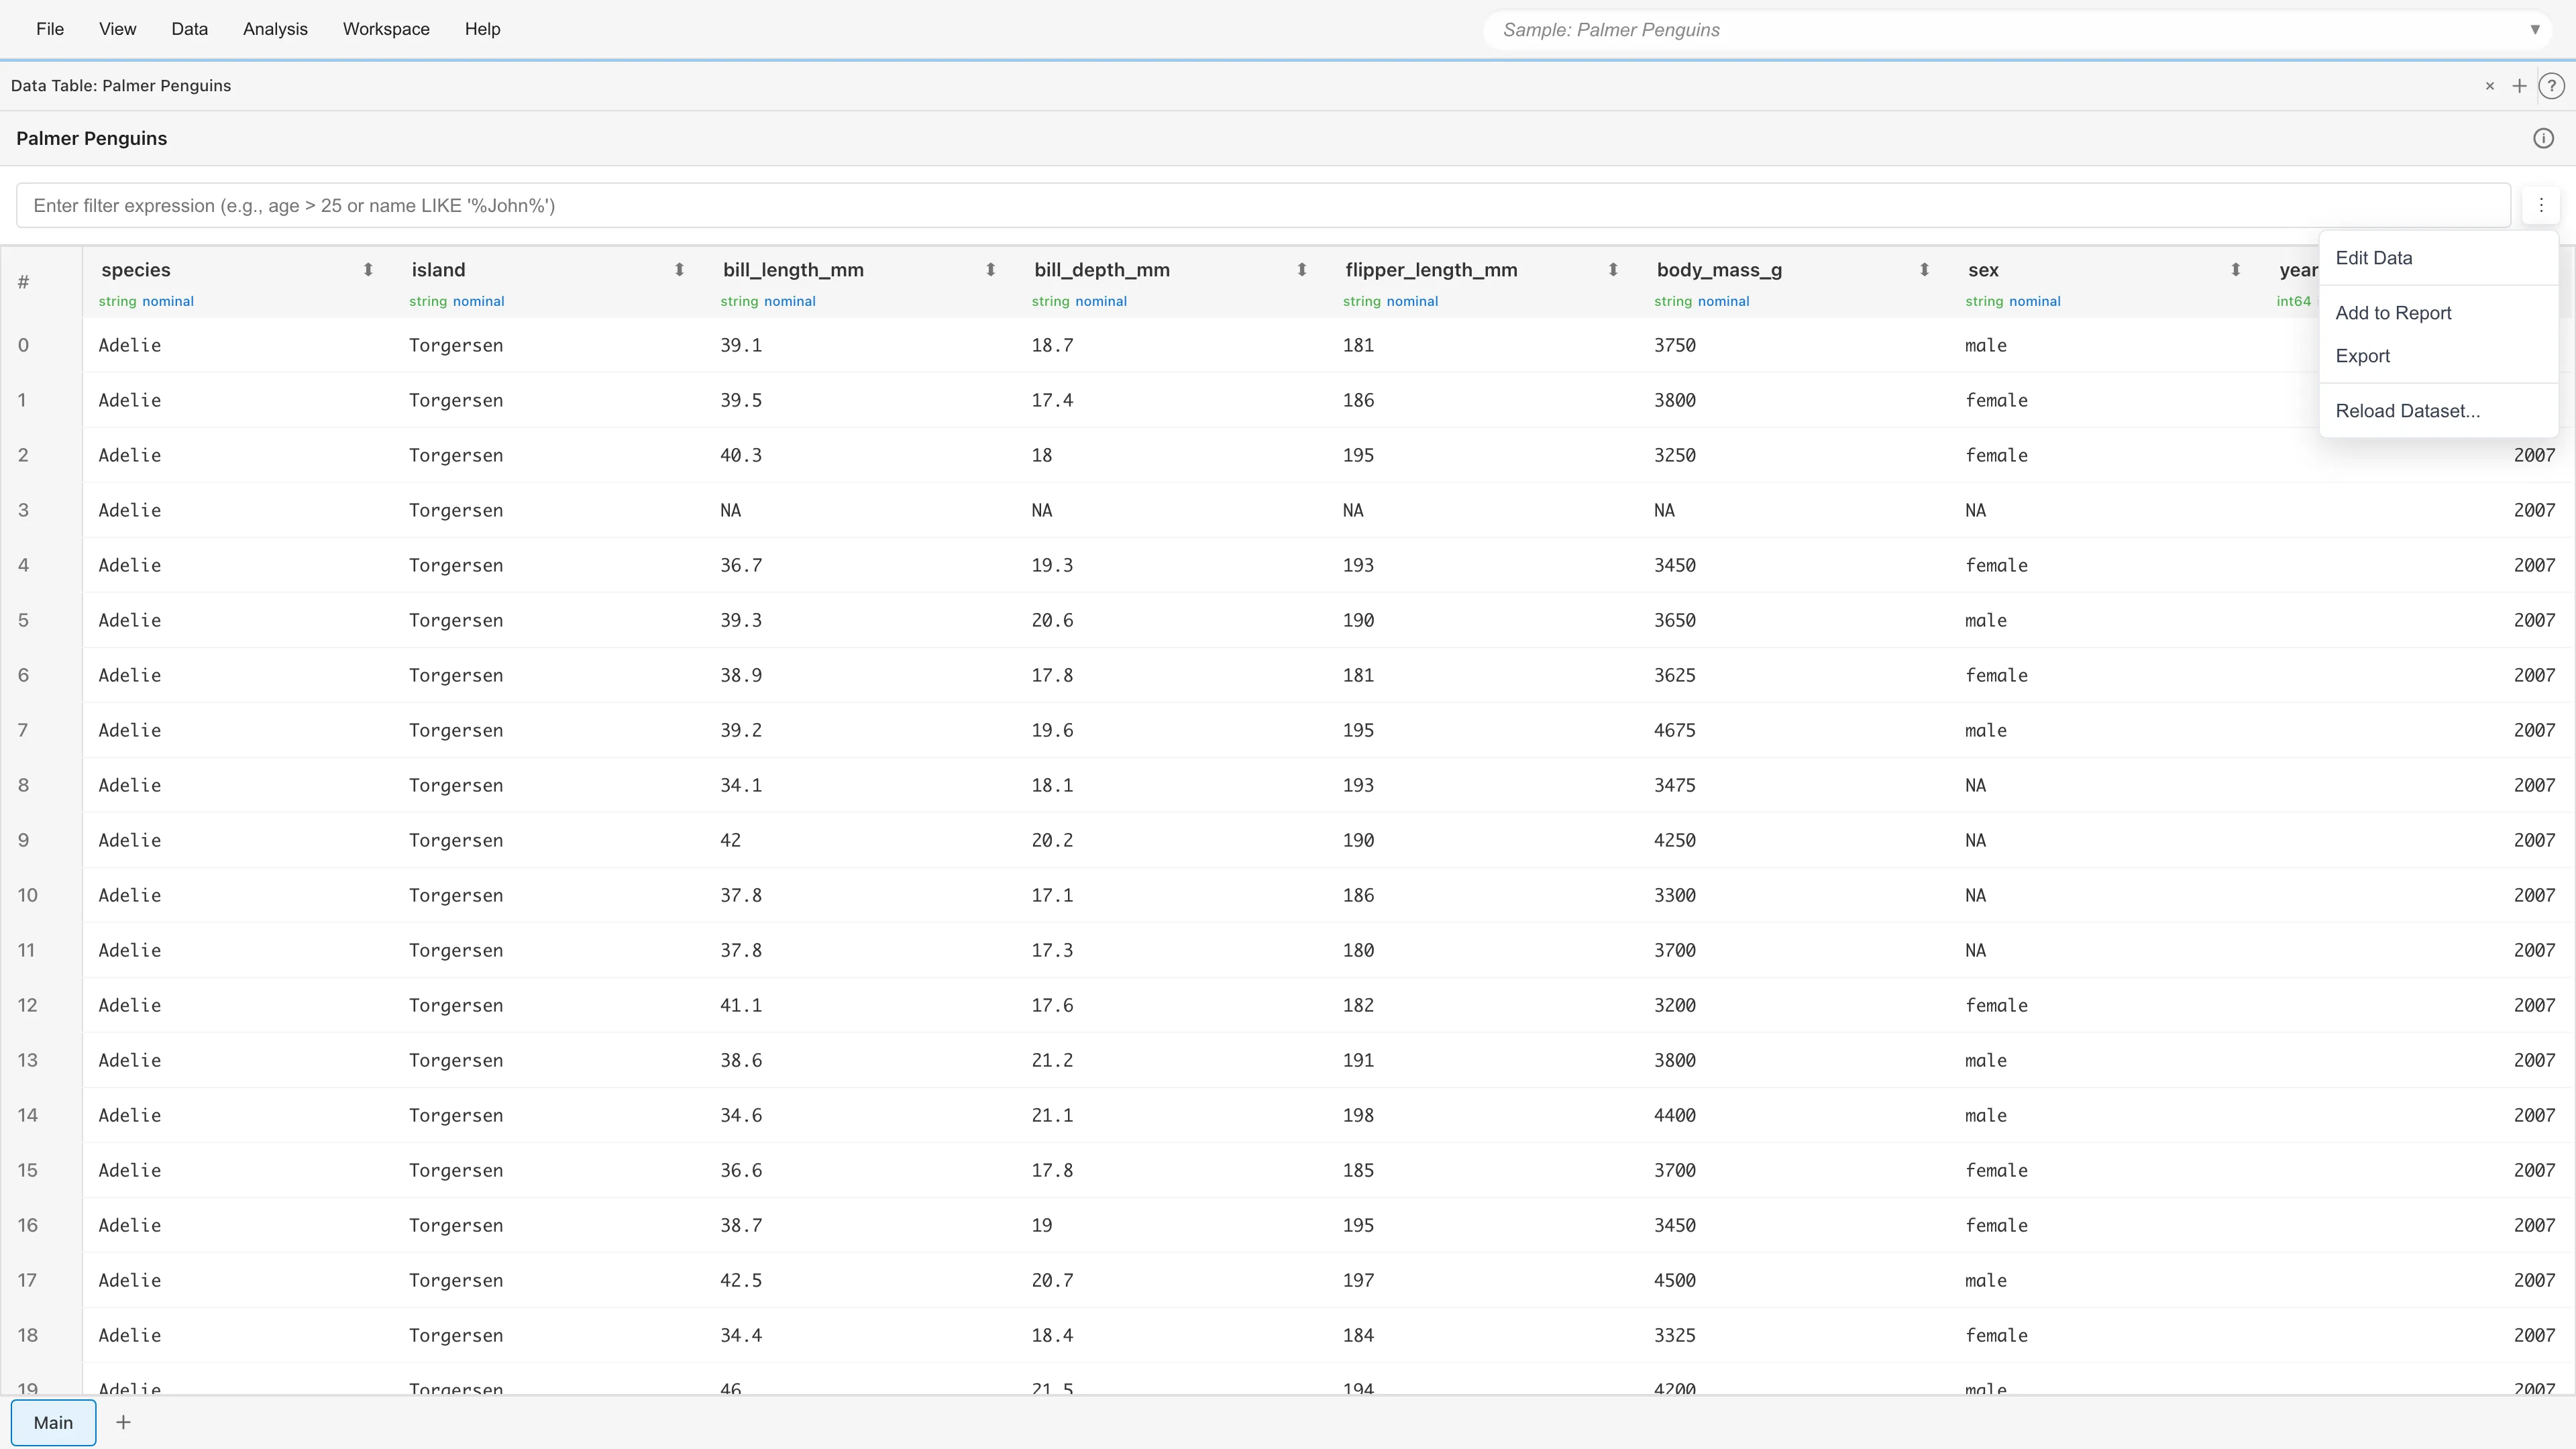
- Edit Data: Edit cell values, add rows, or delete rows (Primary datasets only)
- Add to Report: Add the table to a report
- Export: Export data in CSV, TSV, or JSON format. The current filter and sort order are applied
- View SQL Query: View the original SQL query (derived datasets only)
- Materialize: Save query results to the project file (MDS) (derived datasets only). Normally, derived dataset cache is discarded on save, but Materialize preserves it. Useful for computationally expensive small tables.
- Reload Dataset...: Reload data from the original CSV file. Opens a dialog where you select the file to reload. The column structure (number of columns and data types) must match
Row Number Column
The leftmost column displays row numbers. These row numbers indicate the original data order and do not change when filters or sorting are applied.
Next steps
- Basic Statistics - View statistics for selected columns
- Data Processing with SQL Editor - Process data with SQL
See also
- Data Preparation and Import - About data types and measurement scales