Welch's Test
The Welch's Test tab tests whether the means of a response variable differ across three or more groups. It generalizes the two-sample Welch t-test to k groups and does not assume equal variances.
Basic Usage
Open the Tab
Select Analysis > Welch's Test... from the menu bar.
Run an Analysis
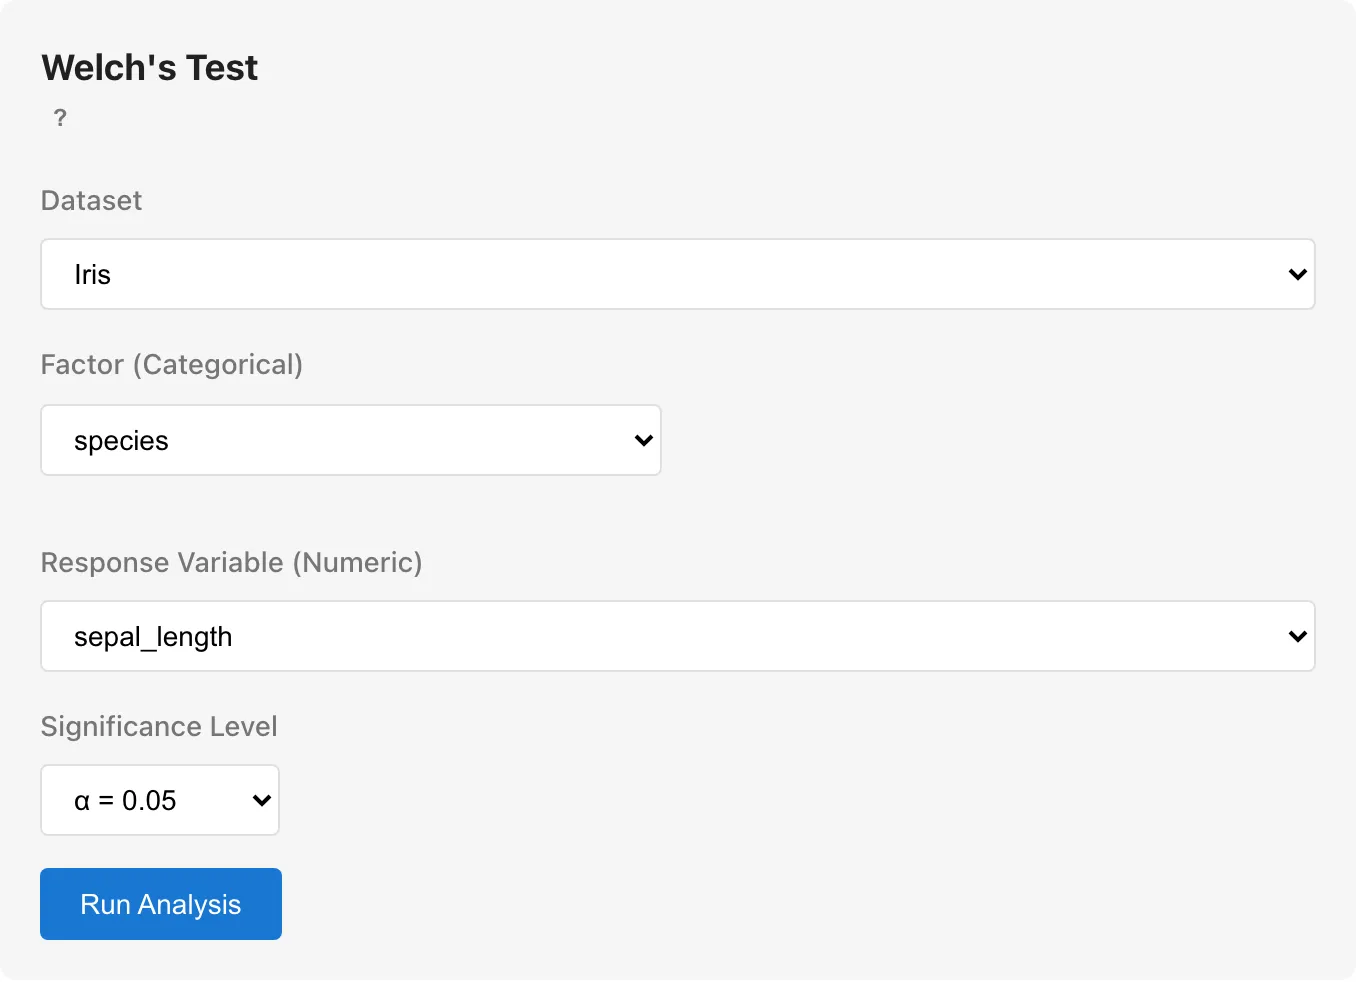
Configure the following in the settings panel:
- Select a dataset from Dataset
- Select a categorical variable for Factor
- Select a numeric variable for Response Variable
- Click Run Analysis
Data Format
Data must be in long format with one row per observation. Use Reshape to convert wide-format data.
Null Hypothesis
Tests whether all group population means are equal. Each group's variance is estimated separately to compute the F* statistic, so equal variances are not assumed. See Hypothesis Testing Concepts for theoretical background.
Variable Selection
Factor (Categorical): Select a categorical variable that defines the groups. Columns with nominal or ordinal measurement scale appear as options.
Response Variable (Numeric): Select the numeric variable to analyze. Columns with interval or ratio measurement scale appear as options.
Significance Level
Set the significance level for the F* test and Games-Howell post-hoc comparisons. Choose from α = 0.10, 0.05 (default), or 0.01. The Games-Howell confidence interval width is 1 − α.
Reading the Results
Observations
The total number of observations used in the analysis appears at the top. If rows were excluded due to missing values, the count of excluded rows is also shown.
Group Statistics
A summary table of descriptive statistics for each group.
| Column | Description |
|---|---|
| Group | Group name |
| N | Number of observations |
| Mean | Group mean |
| SD | Standard deviation (square root of unbiased variance, denominator n − 1) |
| Min | Minimum value |
| Max | Maximum value |
Welch's Test
The Welch F* test results table.
| Column | Description |
|---|---|
| F* | Inverse-variance-weighted F statistic, distinct from the classical ANOVA F statistic |
| df1 | Numerator degrees of freedom (k − 1) |
| df2 | Denominator degrees of freedom from Satterthwaite approximation, generally non-integer |
| Pr(>F*) | p-value -- the probability of observing an F* statistic as extreme as, or more extreme than, the observed value under the null hypothesis |
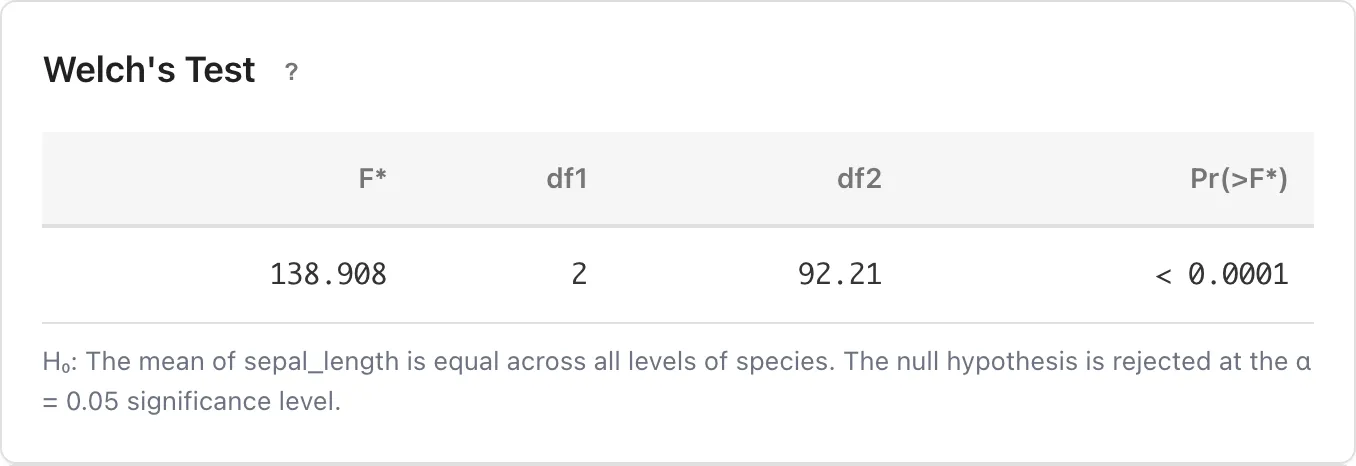
Below the table, the conclusion about rejecting or not rejecting the null hypothesis at the selected significance level is displayed.
Games-Howell Post-Hoc Test
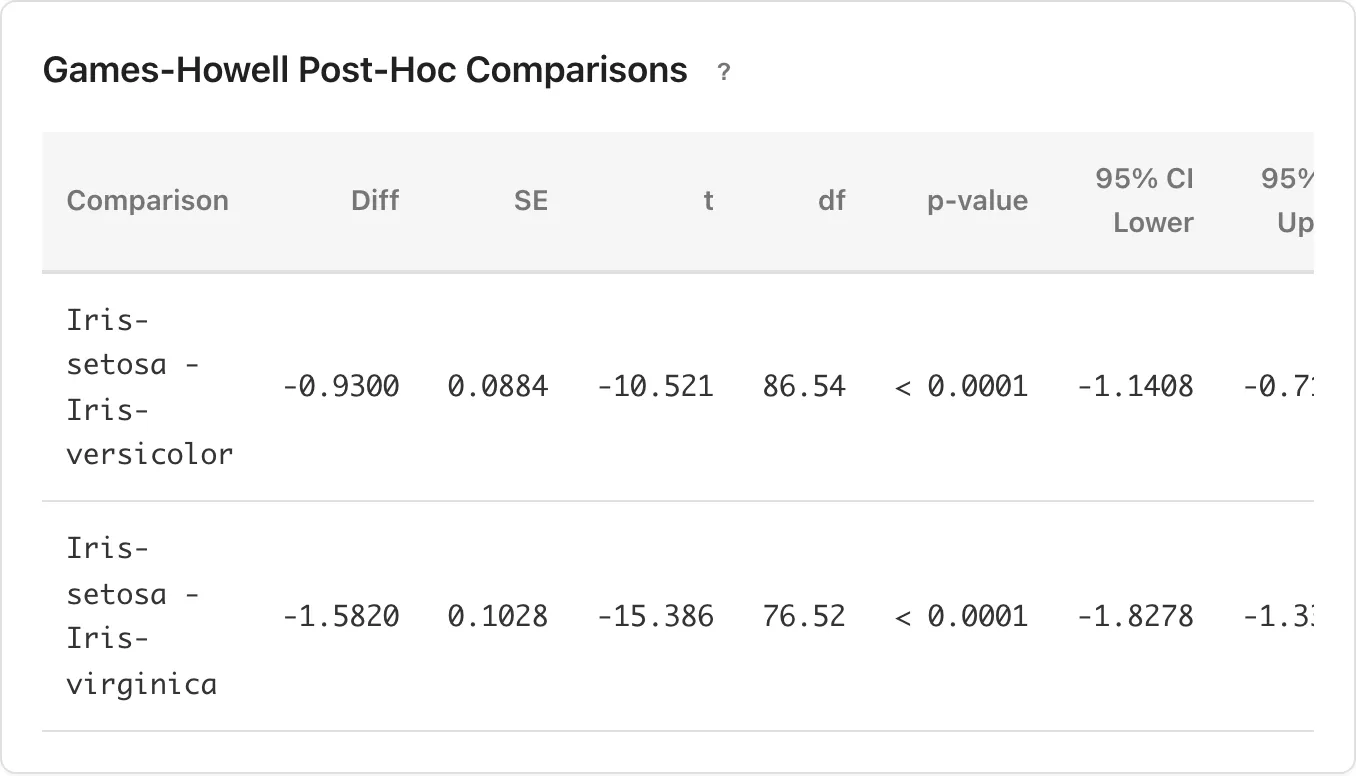
The F* test determines whether at least one group mean differs from the others, but does not identify which pairs of groups differ. The Games-Howell post-hoc test compares all pairs of group means.
It is computed automatically regardless of the F* test result. For each pair, the test computes the same standard error and degrees of freedom as the Welch t-test, then uses the studentized range distribution to control the family-wise error rate. See Hypothesis Testing Concepts for computation details and FWER control.
Results Table
| Column | Description |
|---|---|
| Comparison | The two groups being compared |
| Diff | Difference in means (Group 1 mean − Group 2 mean) |
| SE | Standard error of the difference, using each group's own variance |
| t | t statistic (Diff / SE) |
| df | Welch-Satterthwaite degrees of freedom for this pair, generally non-integer |
| p-value | Adjusted p-value from the studentized range distribution |
| CI Lower / CI Upper | Simultaneous confidence interval for the mean difference |
Assumptions
Welch's Test and the Games-Howell post-hoc test assume the following:
- Independence: Observations are independent of each other
- Normality: The response variable follows a normal distribution within each group. With large sample sizes, the central limit theorem keeps the Type I error rate close to the nominal level. See Hypothesis Testing Concepts for normality diagnostics
Equal variances are not assumed. Use this test when group variances may differ or when group sizes are unequal.
Error Messages
| Message | Cause and resolution |
|---|---|
| Not enough valid observations (at least 3 required) | Fewer than 3 valid observations remain after excluding missing values |
| At least 2 groups are required | The factor variable has only one level |
| Welch ANOVA could not be computed. Each group must have at least 2 observations with non-zero variance. | A group has 1 or fewer observations, or all values within a group are identical |
If the Games-Howell section shows "not available", the cause is the same: a group has fewer than 2 observations or zero variance. The analysis runs with as few as 2 observations per group, but Monte Carlo simulations by Games and Howell (1976) confirmed that the Type I error rate stays near the nominal level when each group has at least 6 observations. Interpret results with caution for smaller samples.
Missing Values
Rows with missing values in the factor or response variable are automatically excluded. The number of excluded rows is displayed in the results panel.
Related Pages
- ANOVA -- one-way and two-way ANOVA assuming equal variances
- Two-Sample Test / Paired Test -- use t-tests for comparing two groups
- Hypothesis Testing Concepts -- background on p-values and statistical testing
References
- Games, P. A., & Howell, J. F. (1976). Pairwise multiple comparison procedures with unequal N's and/or variances: A Monte Carlo study. Journal of Educational Statistics, 1(2), 113--125. https://www.jstor.org/stable/1164979
- Welch, B. L. (1951). On the comparison of several mean values: An alternative approach. Biometrika, 38(3/4), 330--336. https://www.jstor.org/stable/2332579