The Selected Columns Tab
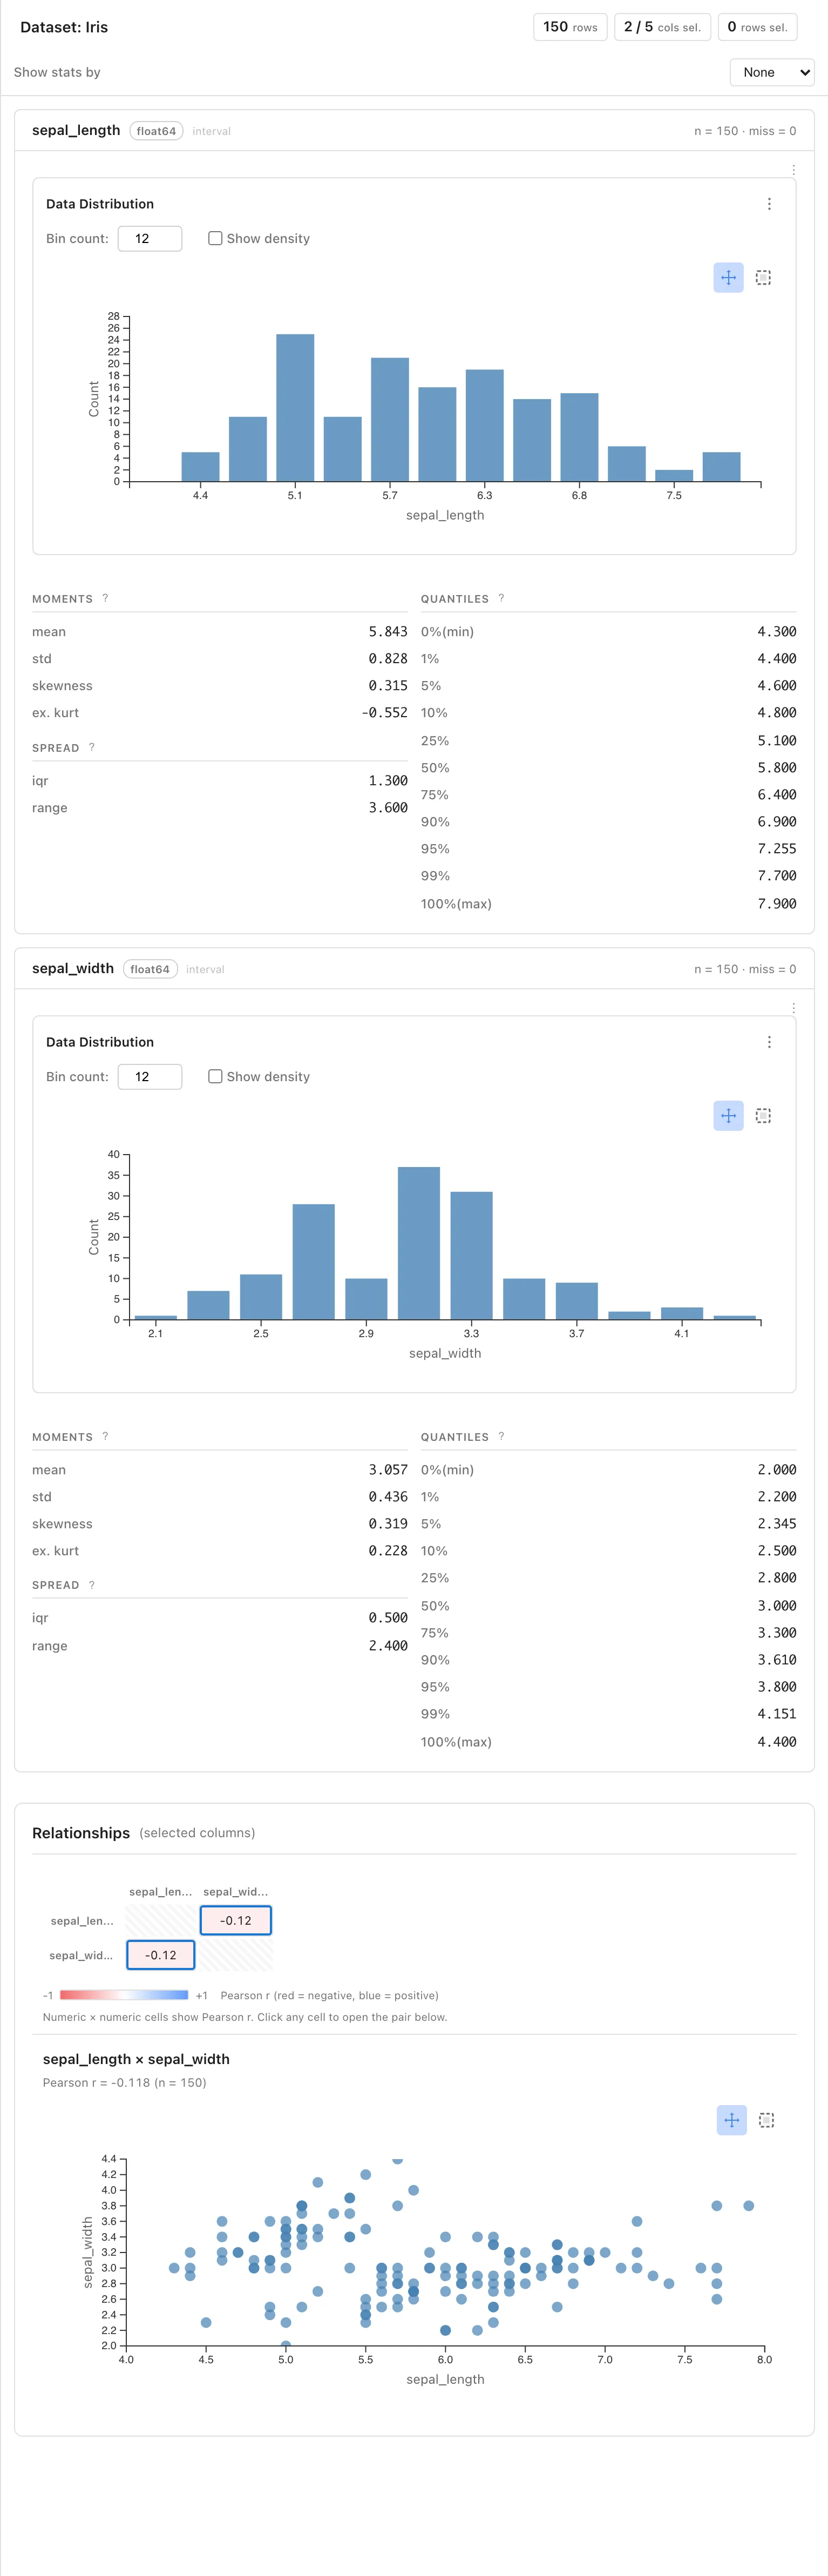
The Selected Columns tab shows the distribution and statistics of the columns you have selected. While the Statistics tab gives an overview of every column, this tab shows only the selected columns at the full width of the pane.
Where It Appears
When you open a project, a Selected Columns tab is automatically created in the right pane next to the Statistics tab. If you close the tab, you can reopen it from View > Selected Columns in the menu bar, the + button in a pane, or the Command Palette (Ctrl/Cmd+P).
When no columns are selected, the tab shows "No columns selected".
Selecting Columns
The column selection is shared across tabs, and either of the following operations produces the same result.
- Click column headers in the Data Table (Ctrl/Cmd+click to add)
- Click rows in the Columns section of the Statistics tab
Clicking a selected column again deselects it.
What It Shows
The header displays the dataset name, the row count, the number of selected columns, and the number of selected rows. Below the header, one section per selected column appears in selection order. Each section starts with the column name, data type, measurement scale, non-null count (n), and missing count (miss), followed by the distribution chart and statistics. The statistics shown depend on the column's data type and measurement scale; see Statistics by Data Type.
Choosing a column in the Show stats by dropdown switches the distributions and statistics to a per-group view. The behavior is the same as grouping in the Statistics tab.
Relationships
With two or more columns selected, a Relationships grid covering only the selected columns appears at the end. When exactly two columns are selected, the detail for that pair opens automatically. The grid and the pair detail are the same as the Relationships section of the Statistics tab.
See also
- The Statistics Tab -- Summary of every column and pairwise relationships
- The Data Table Tab -- Selecting columns and viewing data
- How Row Selection Works -- Selecting rows and how selection is shared across tabs
Also available as a Markdown file.