The Sampling Tab
The Sampling tab draws rows at random from a dataset and saves the result as a Derived Dataset. This page calls the dataset that the rows are drawn from the input dataset.
The following table holds two months of sales for five stores in two regions. This page uses this table as its example.
| region | store | month | sales |
|---|---|---|---|
| East | E1 | 1 | 120 |
| East | E1 | 2 | 135 |
| East | E2 | 1 | 80 |
| East | E2 | 2 | 95 |
| East | E3 | 1 | 150 |
| East | E3 | 2 | 140 |
| West | W1 | 1 | 60 |
| West | W1 | 2 | 75 |
| West | W2 | 1 | 110 |
| West | W2 | 2 | 100 |
Workflow
Sampling in the Sampling tab follows these steps.
- Open the Sampling tab with Data > Sampling...
- In Dataset, choose the input dataset
- In Method, choose With replacement or Without replacement
- Choose a Stratum column to divide the input dataset into strata and draw within them, and a Sampling unit column to draw several rows together
- In Sample size per stratum, choose how the number drawn from each stratum is decided
- Enter the number of times to repeat the sampling in Replicates and an integer that decides the sequence of random numbers in Seed
- Press Preview and check the number of rows and columns of the result and its first 100 rows
- Press Save as Dataset and save the result under a name
Strata and Sampling Units
The Sampling tab divides the input dataset into strata and draws within each stratum. A stratum is the set of rows that share a value in the Stratum column. When the Stratum column is None, the whole input dataset is one stratum. The rows with a missing value in the Stratum column together form one stratum. With region as the Stratum column in the example table, the 6 rows of East and the 4 rows of West are the two strata.
In one draw, the Sampling tab takes one sampling unit from a stratum. When the Sampling unit column is None (each row is a unit), each row is one sampling unit. When you choose a column, all rows of a stratum that share a value in that column form one sampling unit. The Sampling tab takes those rows together in one draw. With store as the Sampling unit column in the example table, the Sampling tab takes the 2 rows that hold the two months of one store in one draw.
The following table is an example of the result of drawing one sampling unit from each stratum, with region as the Stratum column and store as the Sampling unit column. The Sampling tab took store E1 from East and store W2 from West and put the 2 rows of each store in the result. Columns of the Result describes the first three columns.
| Replicate | Draw | Source Row # | region | store | month | sales |
|---|---|---|---|---|---|---|
| 1 | 1 | 0 | East | E1 | 1 | 120 |
| 1 | 1 | 1 | East | E1 | 2 | 135 |
| 1 | 2 | 8 | West | W2 | 1 | 110 |
| 1 | 2 | 9 | West | W2 | 2 | 100 |
Rows that share a value in the Sampling unit column but belong to different strata are separate sampling units. For example, with month as the Stratum column and store as the Sampling unit column in the example table, the month 1 row and the month 2 row of store E1 belong to different strata, so they are separate sampling units.
When the input dataset has rows with a missing value in the Sampling unit column, the Sampling tab cannot draw, and Preview shows an error. A row with a missing value belongs to no sampling unit, so the Sampling tab cannot draw it. The Sampling tab groups the rows with a missing value in the Stratum column into one stratum, but it does not group the rows with a missing value in the Sampling unit column into one sampling unit.
Sample Size per Stratum
Sample size per stratum decides how many sampling units are drawn from each stratum. The Sampling tab counts sampling units, not rows. With a Sampling unit column, the Sampling tab puts all rows of a sampling unit in the result each time it draws that unit. There are four options.
- As many as the stratum has draws as many sampling units as the stratum has
- One fewer than the stratum has draws one fewer sampling unit than the stratum has
- Fixed number draws the number entered in the input field from every stratum
- From a size table reads the number to draw from each stratum from another dataset
On this page, a replicate is the set of rows that the Sampling tab obtains by drawing from each stratum the number of sampling units that Sample size per stratum decides. When Replicates is 1, the resulting dataset is one replicate. When Replicates is 2 or more, the Sampling tab creates that many replicates and stacks them in the resulting dataset.
Without replacement, the number drawn from a stratum can be at most the number of sampling units that the stratum has. As many as the stratum has draws exactly this maximum. The Sampling tab then takes every sampling unit of each stratum once, in random order.
The sample size per stratum decides the expectation of the total of a numeric column within each stratum of a replicate. When sampling units are drawn from a stratum that has , the expected number of times each sampling unit is taken is , with or without replacement. The expected total of a numeric column over the rows drawn from a stratum is therefore times its total over all rows of that stratum. When is the same in every stratum, the expected total of each stratum is proportional to the total of that stratum in the input dataset. With Fixed number, differs between strata that have different numbers of sampling units, so the expected totals of the strata are not proportional to their totals in the input dataset.
Size Table
A size table is a dataset that lists the number to draw from each stratum. The following table is a size table for drawing 2 sampling units from East and 1 from West in the example table. The region column holds the stratum values, and the size column holds the number to draw from each stratum.
| region | size |
|---|---|
| East | 2 |
| West | 1 |
For each stratum of the input dataset, the Sampling tab finds the row of the size table with the same stratum value and draws as many sampling units as the number in that row. In the size table above, the row whose region is East has a size of 2, so the Sampling tab draws 2 sampling units from the East stratum.
Put exactly one row in the size table for each stratum of the input dataset. For the stratum formed by the rows with a missing value in the Stratum column, put the number to draw in a row whose stratum value is missing.
For the column of the numbers to draw, choose a numeric column, and put non-negative integers in it. The Sampling tab draws nothing from a stratum whose number is 0.
For the column of the stratum values, choose a column whose data type can be compared with the Stratum column. String and enum columns can be compared with each other, and so can int64 and float64 columns. A date, datetime, or boolean column can be compared only with a column of the same data type.
Replicates
The Sampling tab creates as many replicates as the number entered in Replicates and stacks them into one dataset. It creates each replicate separately, so the same row can appear in more than one replicate even without replacement. The Sampling tab can create a result of up to 10,000,000 rows.
Seed
Seed is an integer that decides the sequence of random numbers used for the draws. In the same version of MIDAS, the same settings and the same Seed give the same replicates from the same data. After MIDAS is updated, the replicates can differ for the same Seed. When Replicates is 2 or more, there is still one Seed, and it decides all the replicates.
Columns of the Result
The resulting dataset has three columns, Replicate, Draw, and Source Row #, before the columns of the input dataset, and its rows are ordered by the values of these three columns. The three columns hold the following values.
Replicateis the number of the replicate, starting from 1Drawis the order of the draw within the replicate, starting from 1Source Row #is the row number that the drawn row has in the input dataset
The following screen shows the result of sampling with replacement from the example table. The Stratum column is region, the Sampling unit column is store, Sample size per stratum is As many as the stratum has, and Replicates is 2. For one replicate, the Sampling tab takes a store 3 times from East and 2 times from West. Each draw takes 2 rows, so the two replicates together have 20 rows.
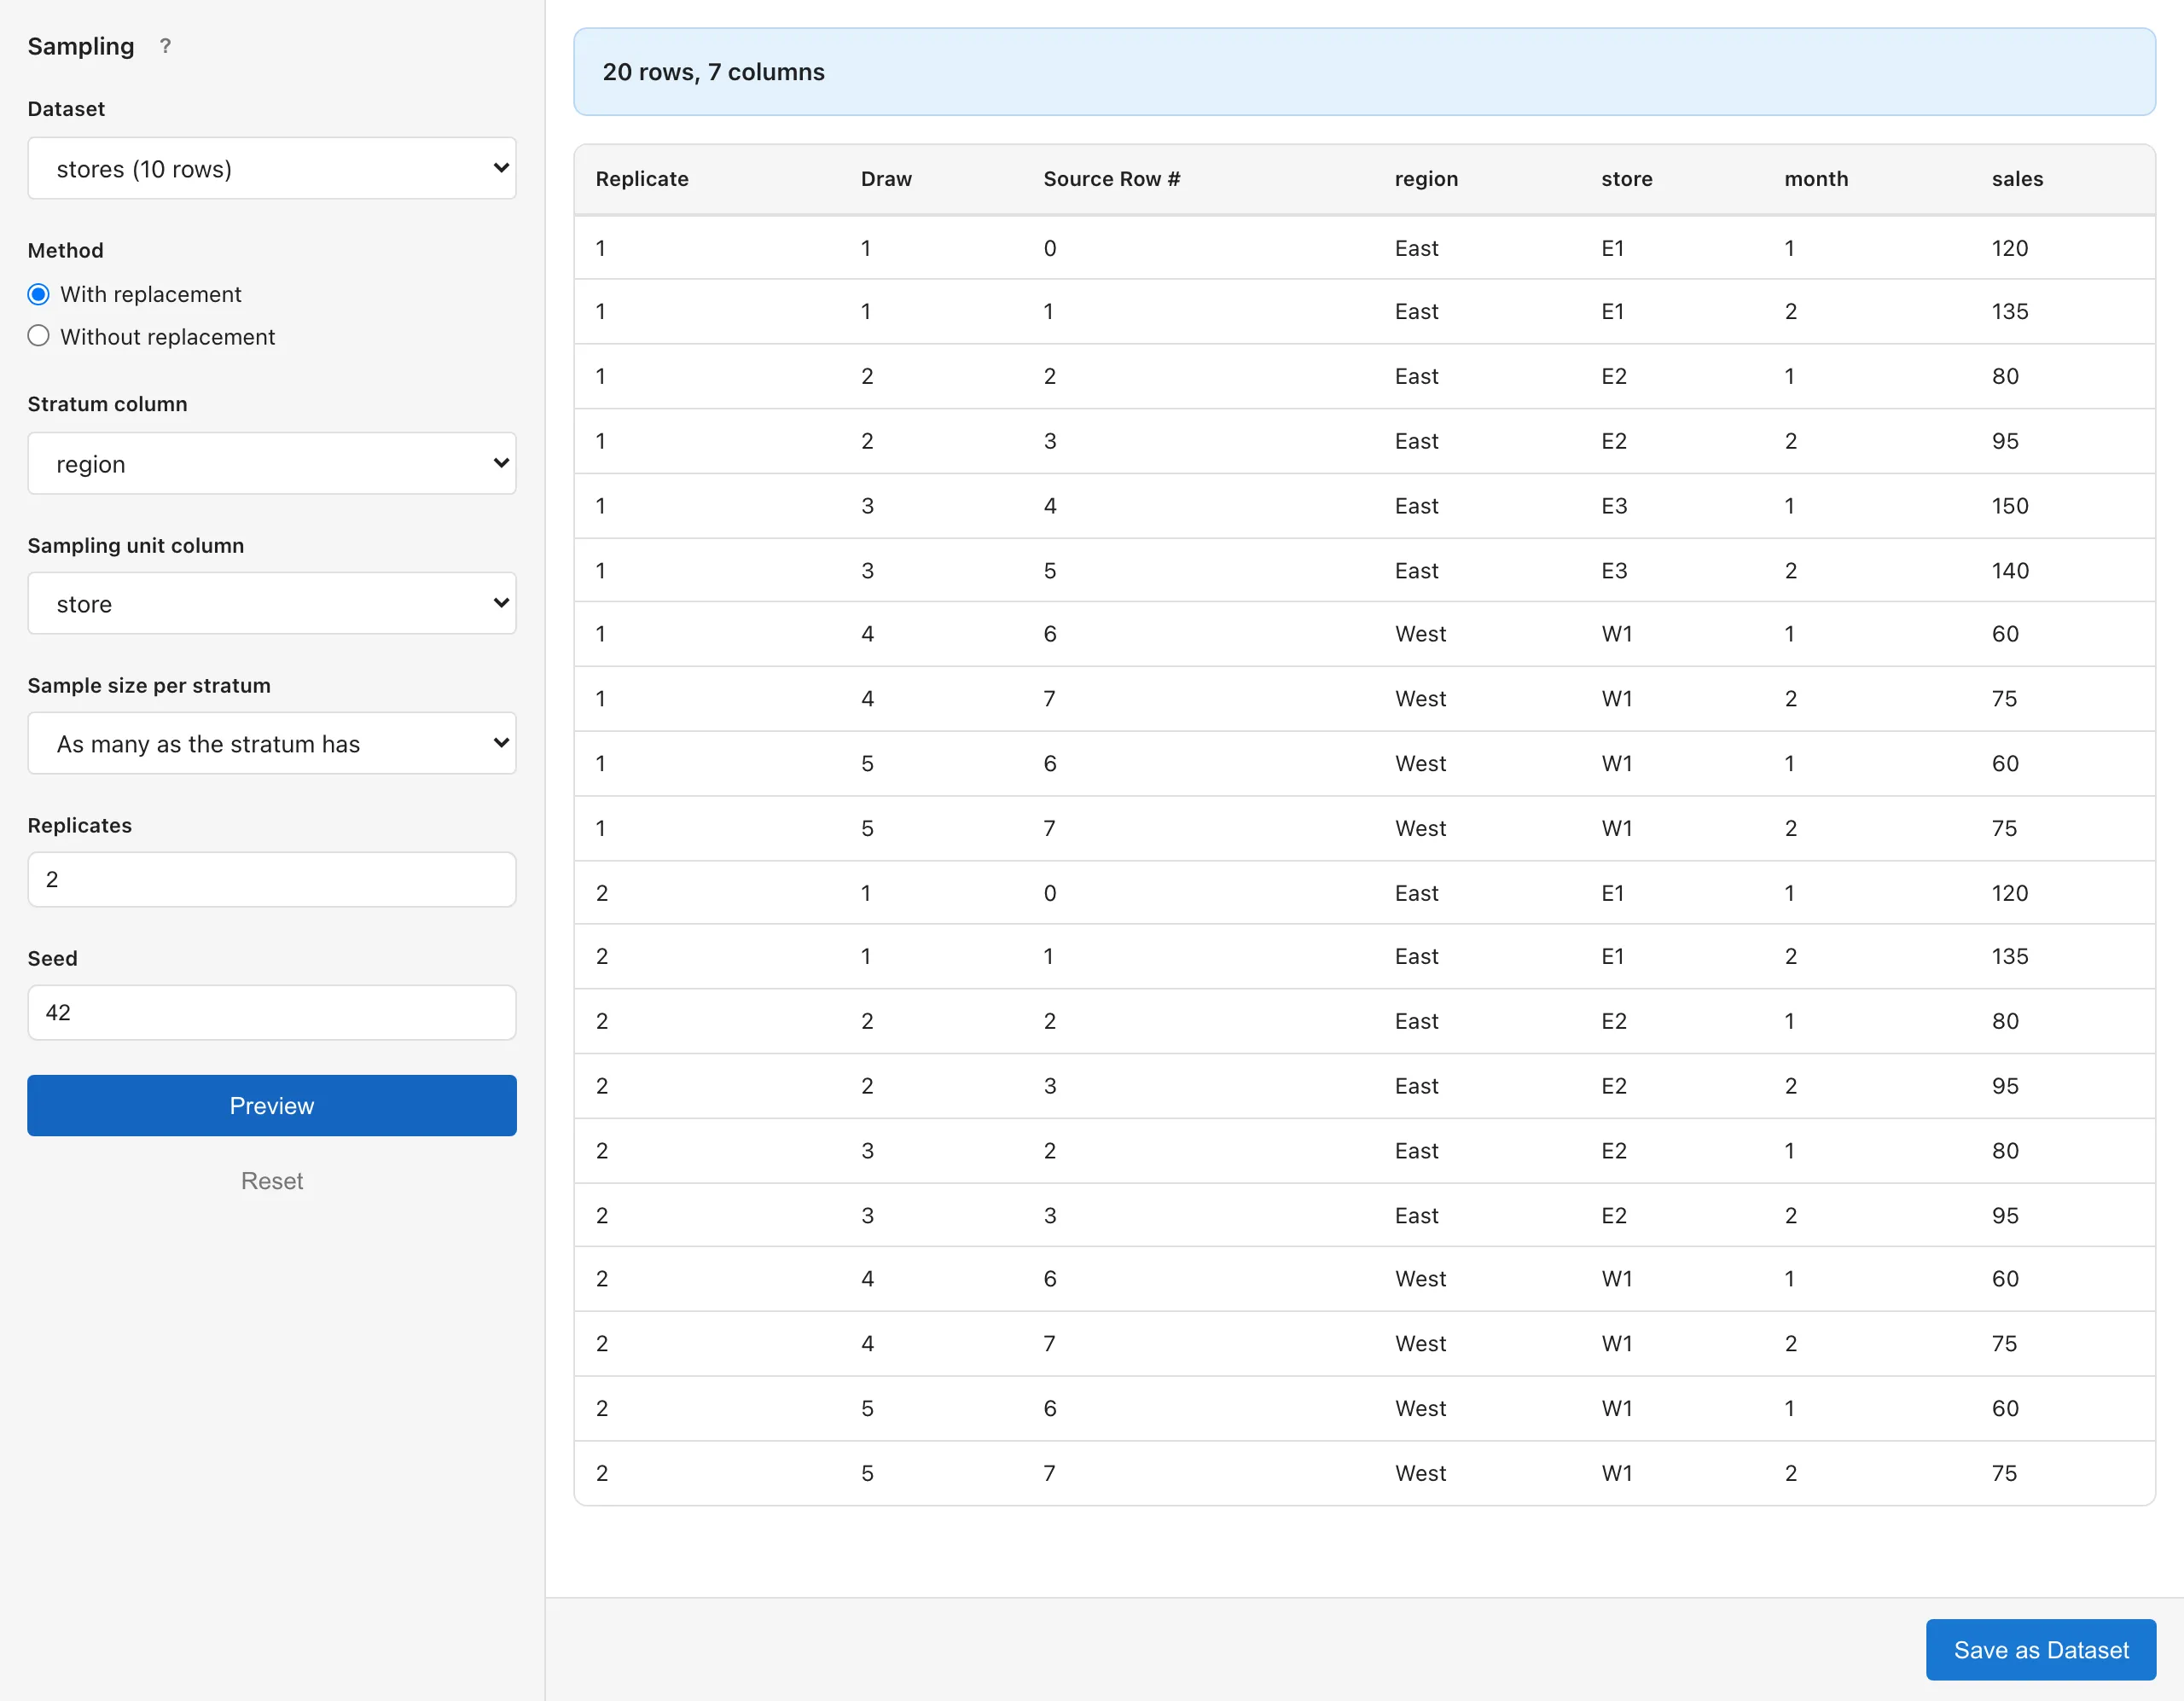
The Draw numbers continue across strata within one replicate. In the screen, Draw 1 to 3 are the draws from East, and 4 and 5 are the draws from West. The rows taken by one draw share a Draw value.
When sampling with replacement takes the same sampling unit more than once, Replicate and Draw together identify each time. The rows of a sampling unit that the Sampling tab takes twice for one replicate appear twice in the result. The two sets of rows have the same values in the Sampling unit column and in Source Row #, and differ only in Draw. In the screen, the Sampling tab takes store W1 twice for the first replicate, and the 2 rows of W1 appear once under Draw 4 and once under Draw 5.
Saved Dataset
When you change the input dataset or the size table, MIDAS draws the rows of a Derived Dataset saved with Save as Dataset again with the same settings and Seed. Datasets and Dependencies describes dependencies and recomputation.
To change the sampling settings of a saved Derived Dataset, right-click the dataset in the Project Lineage tab and open the Sampling tab with Edit Operation.... Change the settings and then update the dataset from Update Dataset.
Also available as a Markdown file.